Palatka: Fire Incidents, Florida (FL)
Where are fire incidents reported in Palatka, FL
Something went wrong! Please refresh the page.
| Fire incidents reported | |
|---|---|
| Sreet name | Count |
| STATE RD 19 | 72 |
| 215 CR 216 | 52 |
| REID ST | 44 |
| COUNTY RD 216 | 40 |
| MONDEX | 40 |
| HIGHWAY 17 | 36 |
| 6710 ST JOHNS AVE | 32 |
| SILVER LAKE DR | 28 |
| ST JOHNS AVE | 28 |
| 215 COUNTY ROAD 216 | 24 |
| BARDIN RD | 24 |
| COMFORT RD | 20 |
| PALM AVE | 20 |
| ST JOHNS AV | 20 |
| STOKES LANDING RD | 20 |
| LETTIE LN | 18 |
| CR 216 | 16 |
| PENIEL RD | 16 |
| RODMAN RD | 16 |
| 2305 HUSSON AVE | 14 |
| ALABAMA AVE | 14 |
| BRONSON ST | 14 |
| BROWNS LANDING RD | 14 |
| ST. JOHNS AV. | 14 |
| WESTOVER DR | 14 |
| 131 CRYSTAL COVE DR | 12 |
| 400 N SR 19 | 12 |
| 611 ZEAGLER DR | 12 |
| CRILL AVE | 12 |
| HARVEY DR | 12 |
| Other | 2,044 |
2003 - 2018 National Fire Incident Reporting System (NFIRS) incidents
- Incident types reported to NFIRS in Palatka, FL
- 15,16060.5%Rescue & EMS
- 3,62914.5%Hazardous Condition
- 2,75411.0%Fire
- 1,6196.5%Service Call
- 1,0244.1%Good Intent Call
- 7172.9%False Alarm
- 840.3%Special Incident
- 690.3%Severe Weather
- Fire incident types reported to NFIRS in Palatka, FL
- 1,14541.6%Outside Fires
- 1,06138.5%Structure Fires
- 39414.3%Mobile Property/Vehicle Fires
- 1545.6%Other
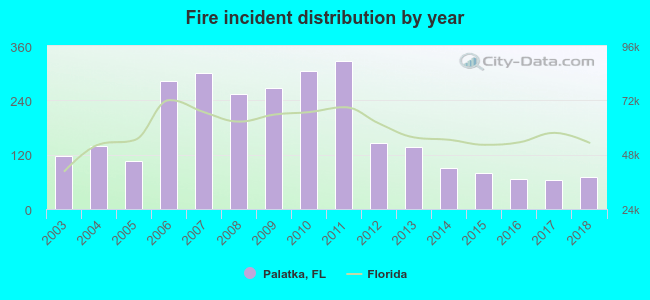 Based on the data from the years 2003 - 2018 the average number of fire incidents per year is 172. The highest number of fire incidents - 327 took place in 2011, and the least - 65 in 2017. The data has a decreasing trend.
The average number of yearly fire incidents per 10k residents in Palatka, FL compared to nearest cities:
(Note: Based on data for the last 3 years, including only cities with population 5,000 and above)
| Palatka: | 64.5 |
| Green Cove Springs: | 4.2 |
| Palm Coast: | 25.2 |
| Fleming Island: | 1.3 |
| Middleburg: | 6.9 |
| Starke: | 142.4 |
| Orange Park: | 19.8 |
| Gainesville: | 33.8 |
| Ponte Vedra: | 11.0 |
 The median response time based on all reported fire incidents is 6 minutes. This is close to the state median value.
The median response time in Palatka, FL compared to nearest cities:
(Note: Based on data for all years, including only cities with at least 500 fire incidents)
| Palatka: | 6 minutes |
| Hastings: | 12 minutes |
| Interlachen: | 10 minutes |
| Keystone Heights: | 11 minutes |
| Hawthorne: | 12 minutes |
| St. Augustine: | 8 minutes |
| Bunnell: | 12 minutes |
| Palm Coast: | 6 minutes |
| Middleburg: | 10 minutes |
 Based on the data from the years 2003 - 2018 the average number of fire-related yearly deaths is 0. The highest number of reported deaths - 1 took place in 2008, and the lowest - 0 in 2003. The data has a constant trend.
The average number of deaths per 1,000 fire incidents is 1. This indicator was the highest - 7 in 2013, and the lowest 0 in 2003. The trend for deaths per 1,000 fire incidents is constant. Compared to the state value the number of fatalities per 1,000 incidents is lower.
Based on the data from the years 2003 - 2018 the average number of fire-related yearly deaths is 0. The highest number of reported deaths - 1 took place in 2008, and the lowest - 0 in 2003. The data has a constant trend.
The average number of deaths per 1,000 fire incidents is 1. This indicator was the highest - 7 in 2013, and the lowest 0 in 2003. The trend for deaths per 1,000 fire incidents is constant. Compared to the state value the number of fatalities per 1,000 incidents is lower.Deaths per 1,000 incidents in Palatka, FL compared to nearest cities:
(Note: Based on data for all years, including only cities with at least 2,500 fire incidents)
| Palatka: | 1.1 |
| St. Augustine: | 2.3 |
| Palm Coast: | 3.1 |
| Gainesville: | 1.7 |
| Ormond Beach: | 2.3 |
| Ocala: | 2.8 |
| Jacksonville: | 2.1 |
| Daytona Beach: | 2.4 |
 Based on the reports from the years 2003 - 2018 the average number of fire-related yearly casualties is 2. The highest number of reported casualties - 7 took place in 2009, and the lowest - 0 in 2003. The data has a constant trend.
The average number of injuries per 1,000 fires is 9. This indicator was the highest - 48 in 2005, and the lowest 0 in 2003. The trend for casualties per 1,000 fires is increasing. Compared to the state value the number of injuries per 1,000 incidents is lower.
Based on the reports from the years 2003 - 2018 the average number of fire-related yearly casualties is 2. The highest number of reported casualties - 7 took place in 2009, and the lowest - 0 in 2003. The data has a constant trend.
The average number of injuries per 1,000 fires is 9. This indicator was the highest - 48 in 2005, and the lowest 0 in 2003. The trend for casualties per 1,000 fires is increasing. Compared to the state value the number of injuries per 1,000 incidents is lower.Casualties per 1,000 incidents in Palatka, FL compared to nearest cities:
(Note: Based on data for all years, including only cities with at least 500 fire incidents)
| Palatka: | 9.4 |
| Hastings: | 17.4 |
| Interlachen: | 0.0 |
| Keystone Heights: | 2.0 |
| Hawthorne: | 2.8 |
| St. Augustine: | 11.7 |
| Bunnell: | 1.9 |
| Palm Coast: | 8.4 |
| Middleburg: | 1.0 |
 30.7% incidents where reported in the morning and 69.3% in the evening. The most fires (16.0%) took place on Saturday, and the least (13.2%) on Tuesday.
 According to the 2,754 fire incident reports from years 2003 - 2018 most fires (11.9%) took place during June, and the least (5.4%) in September.
 Out of all 25,065 cases reported during the years 2003 - 2018, the most belonged to the categories: Rescue & EMS (60.5%), Hazardous Condition (14.5%), and Fire (11.0%).
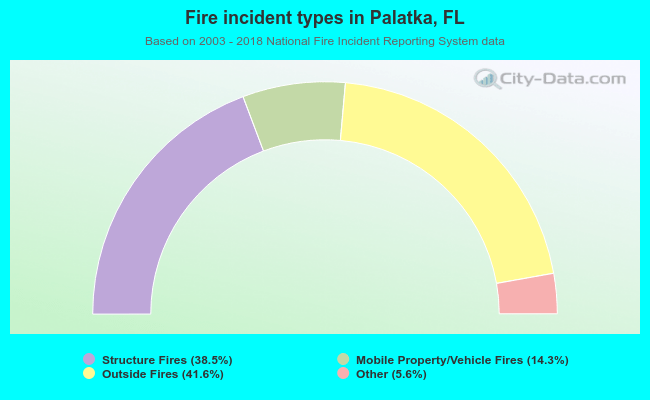 When looking into fire subcategories, the most reports belonged to: Outside Fires (41.6%), and Structure Fires (38.5%).