Ocala: Fire Incidents, Florida (FL)
Where are fire incidents reported in Ocala, FL
Something went wrong! Please refresh the page.
| Fire incidents reported | |
|---|---|
| Sreet name | Count |
| SILVER SPRINGS BLVD | 578 |
| PINE AVE | 416 |
| 27TH AVE | 386 |
| MARICAMP RD | 380 |
| COLLEGE RD | 362 |
| 10TH ST | 242 |
| SB I75 | 242 |
| 7TH ST | 224 |
| MAGNOLIA AVE | 216 |
| NB I75 | 212 |
| 14TH ST | 202 |
| US HWY 441 | 194 |
| HWY 40 | 186 |
| GAINESVILLE RD | 184 |
| 2ND ST | 182 |
| HWY 326 | 182 |
| HWY 200 | 180 |
| 1ST AVE | 178 |
| 20TH ST | 174 |
| 36TH AVE | 168 |
| BLITCHTON RD | 168 |
| 35TH ST | 164 |
| 17TH ST | 162 |
| 25TH AVE | 156 |
| 3RD ST | 154 |
| 58TH AVE | 140 |
| US HWY 27 | 134 |
| 60TH AVE | 124 |
| 80TH AVE | 124 |
| 38TH AVE | 116 |
| Other | 4,728 |
2003 - 2018 National Fire Incident Reporting System (NFIRS) incidents
- Incident types reported to NFIRS in Ocala, FL
- 113,70765.7%Rescue & EMS
- 17,98210.4%Good Intent Call
- 13,2897.7%Hazardous Condition
- 11,2586.5%Fire
- 9,3435.4%Service Call
- 7,0314.1%False Alarm
- 2130.1%Special Incident
- Fire incident types reported to NFIRS in Ocala, FL
- 5,40948.0%Outside Fires
- 3,07427.3%Structure Fires
- 2,18119.4%Mobile Property/Vehicle Fires
- 5945.3%Other
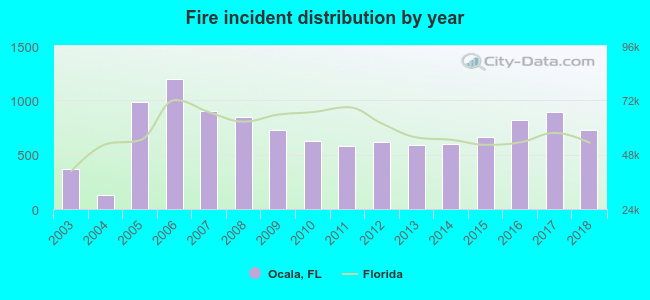 Based on the data from the years 2003 - 2018 the average number of fires per year is 704. The highest number of reported fires - 1,196 took place in 2006, and the least - 125 in 2004. The data has an increasing trend.
The average number of yearly fire incidents per 10k residents in Ocala, FL compared to nearest cities:
(Note: Based on data for the last 3 years, including only cities with population 5,000 and above)
| Ocala: | 141.4 |
| The Villages: | 6.6 |
| Lady Lake: | 50.0 |
| Hernando: | 43.4 |
| Wildwood: | 141.6 |
| Citrus Springs: | 7.5 |
| Beverly Hills: | 30.0 |
| Inverness: | 81.9 |
| Leesburg: | 110.9 |
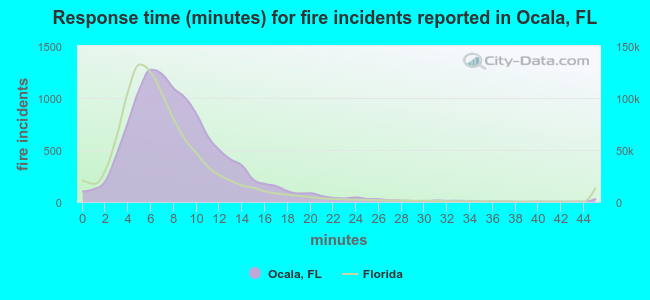 The median response time based on all reported fire incidents is 8 minutes. This is higher than the Florida median value.
The median response time in Ocala, FL compared to nearest cities:
(Note: Based on data for all years, including only cities with at least 500 fire incidents)
| Ocala: | 8 minutes |
| Belleview: | 8 minutes |
| Reddick: | 11 minutes |
| Morriston: | 14 minutes |
| The Villages: | 5 minutes |
| Lady Lake: | 7 minutes |
| Dunnellon: | 10 minutes |
| Hernando: | 12 minutes |
| Wildwood: | 8 minutes |
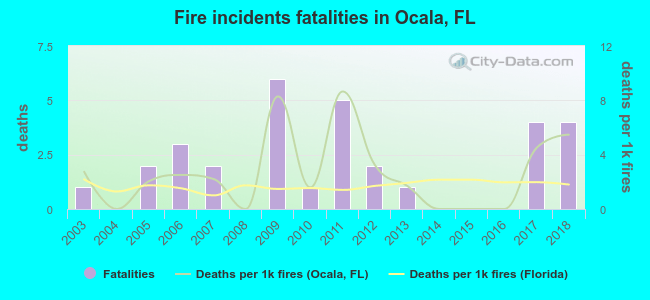 Based on the reports from the years 2003 - 2018 the average number of fire-related yearly deaths is 2. The highest number of reported deaths - 6 took place in 2009, and the lowest - 0 in 2004. The data has an increasing trend.
The average number of fatalities per 1,000 fires is 3. This indicator was the highest - 9 in 2011, and the lowest 0 in 2004. The trend for fatalities per 1,000 fire incidents is growing. Compared to the Florida value the number of fatalities per 1,000 fire incidents is higher.
Based on the reports from the years 2003 - 2018 the average number of fire-related yearly deaths is 2. The highest number of reported deaths - 6 took place in 2009, and the lowest - 0 in 2004. The data has an increasing trend.
The average number of fatalities per 1,000 fires is 3. This indicator was the highest - 9 in 2011, and the lowest 0 in 2004. The trend for fatalities per 1,000 fire incidents is growing. Compared to the Florida value the number of fatalities per 1,000 fire incidents is higher.Deaths per 1,000 incidents in Ocala, FL compared to nearest cities:
(Note: Based on data for all years, including only cities with at least 2,500 fire incidents)
| Ocala: | 2.8 |
| Leesburg: | 2.0 |
| Gainesville: | 1.7 |
| Palatka: | 1.1 |
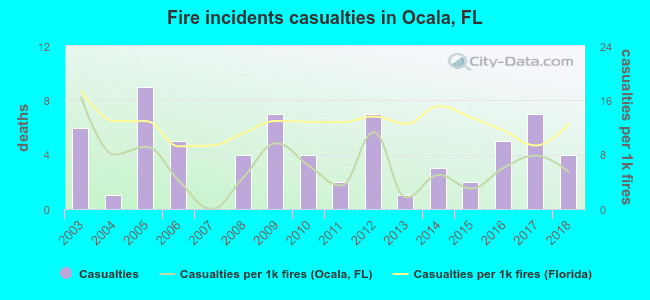 Based on the reports from the years 2003 - 2018 the average number of fire-related casualties per year is 4. The highest number of injuries - 9 took place in 2005, and the lowest - 0 in 2007. The data has a dropping trend.
The average number of injuries per 1,000 fire incidents is 6. This indicator was the highest - 16 in 2003, and the lowest 0 in 2007. The trend for casualties per 1,000 fires is dropping. Compared to the state value the number of injuries per 1,000 incidents is much lower.
Based on the reports from the years 2003 - 2018 the average number of fire-related casualties per year is 4. The highest number of injuries - 9 took place in 2005, and the lowest - 0 in 2007. The data has a dropping trend.
The average number of injuries per 1,000 fire incidents is 6. This indicator was the highest - 16 in 2003, and the lowest 0 in 2007. The trend for casualties per 1,000 fires is dropping. Compared to the state value the number of injuries per 1,000 incidents is much lower.
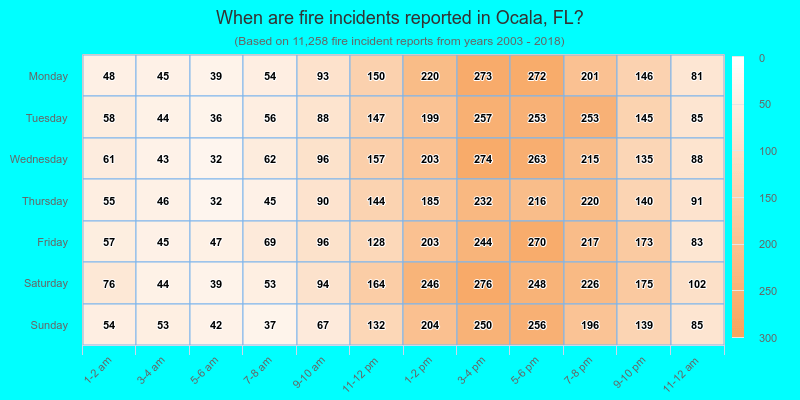
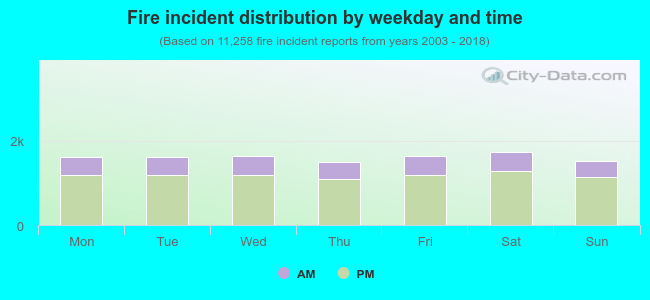 26.8% incidents where reported in the morning and 73.2% in the evening. The most fires (15.5%) took place on Saturday, and the least (13.3%) on Thursday.
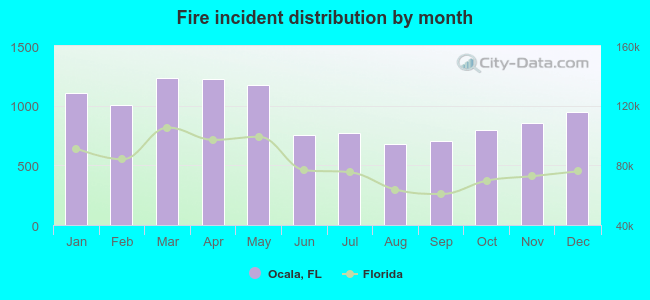 Based on the 11,258 incident reports from years 2003 - 2018 most fires (11.0%) took place during March, and the least (6.0%) in August.
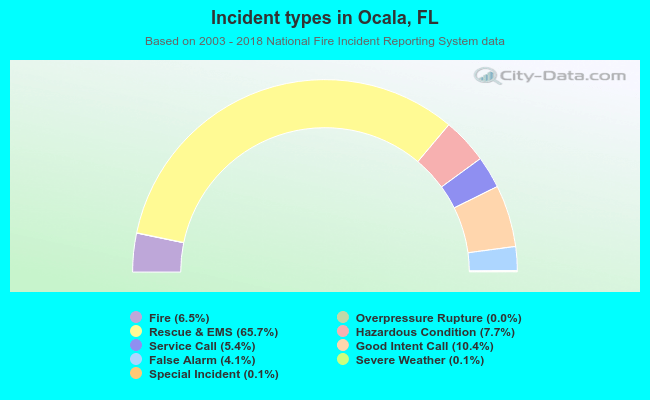 Out of all 172,999 cases reported during the years 2003 - 2018, the most belonged to the categories: Rescue & EMS (65.7%), Good Intent Call (10.4%), and Hazardous Condition (7.7%).
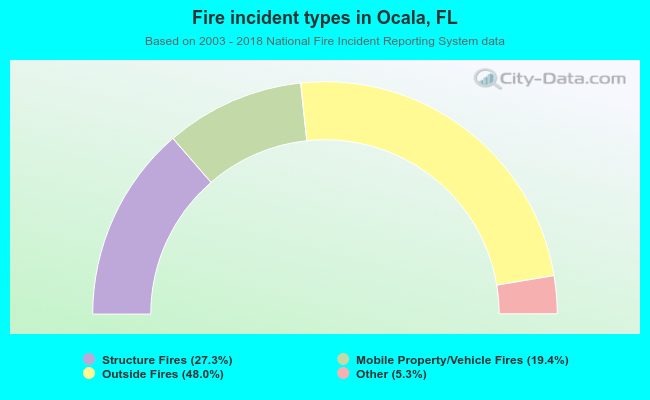 When looking into fire subcategories, the most incidents belonged to: Outside Fires (48.0%), and Structure Fires (27.3%).