Paducah: Fire Incidents, Kentucky (KY)
Where are fire incidents reported in Paducah, KY
Something went wrong! Please refresh the page.
| Fire incidents reported | |
|---|---|
| Sreet name | Count |
| BENTON RD | 194 |
| CAIRO RD | 166 |
| CLARKS RIVER RD | 148 |
| HUSBANDS RD | 146 |
| OAKS RD | 140 |
| BLANDVILLE RD | 100 |
| OLD MAYFIELD RD | 94 |
| I-24 | 82 |
| I24 | 76 |
| HINKLEVILLE RD | 58 |
| NOBLE RD | 54 |
| OGDEN LANDING RD | 52 |
| MAYFIELD METROPOLIS RD | 50 |
| OLD HINKLEVILLE RD | 46 |
| OLIVET CHURCH RD | 44 |
| IRVIN COBB DR | 42 |
| HOMEWOOD DR | 36 |
| OLD HWY 60 RD | 36 |
| PARK AVE | 36 |
| BROADWAY | 34 |
| LOVELACEVILLE RD | 34 |
| NEW HIGHWAY 60 | 34 |
| YARBRO LANE | 34 |
| 6TH ST | 32 |
| I 24 | 32 |
| LONE OAK RD | 32 |
| 21ST ST | 30 |
| HARDMONEY RD | 30 |
| KY DAM RD | 30 |
| LIGHTFOOT RD | 30 |
| Other | 1,814 |
2002 - 2018 National Fire Incident Reporting System (NFIRS) incidents
- Incident types reported to NFIRS in Paducah, KY
- 6,11542.1%Rescue & EMS
- 3,76625.9%Fire
- 1,3639.4%Hazardous Condition
- 1,2848.8%False Alarm
- 1,2618.7%Good Intent Call
- 6154.2%Service Call
- 550.4%Special Incident
- 410.3%Overpressure Rupture
- 220.2%Severe Weather
- Fire incident types reported to NFIRS in Paducah, KY
- 1,58842.2%Outside Fires
- 1,58342.0%Structure Fires
- 53214.1%Mobile Property/Vehicle Fires
- 631.7%Other
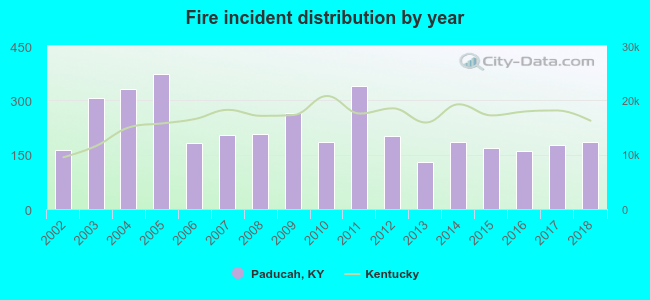 According to the data from the years 2002 - 2018 the average number of fire incidents per year is 222. The highest number of fire incidents - 374 took place in 2005, and the least - 129 in 2013. The data has a rising trend.
The average number of yearly fire incidents per 10k residents in Paducah, KY compared to nearest cities:
(Note: Based on data for the last 3 years, including only cities with population 5,000 and above)
| Paducah: | 70.1 |
| Symsonia: | 26.7 |
| Mayfield: | 79.0 |
| Fairdealing: | 1.6 |
| Murray: | 67.1 |
 The median response time based on all reported fire incidents is 6 minutes. This is close to the Kentucky median value.
The median response time in Paducah, KY compared to nearest cities:
(Note: Based on data for all years, including only cities with at least 500 fire incidents)
| Paducah: | 6 minutes |
| Metropolis: | 5 minutes |
| Calvert City: | 8 minutes |
| Benton: | 8 minutes |
| Mayfield: | 5 minutes |
| Cairo: | 3 minutes |
| Murray: | 5 minutes |
 Based on the reports from the years 2002 - 2018 the average number of fire-related yearly deaths is 0. The highest number of reported deaths - 2 took place in 2003, and the lowest - 0 in 2002. The data has a constant trend.
The average number of fatalities per 1,000 fire incidents is 1. This indicator was the highest - 7 in 2003, and the lowest 0 in 2002. The trend for fatalities per 1,000 fires is constant. Compared to the Kentucky value the number of fatalities per 1,000 incidents is lower.
Based on the reports from the years 2002 - 2018 the average number of fire-related yearly deaths is 0. The highest number of reported deaths - 2 took place in 2003, and the lowest - 0 in 2002. The data has a constant trend.
The average number of fatalities per 1,000 fire incidents is 1. This indicator was the highest - 7 in 2003, and the lowest 0 in 2002. The trend for fatalities per 1,000 fires is constant. Compared to the Kentucky value the number of fatalities per 1,000 incidents is lower.Deaths per 1,000 incidents in Paducah, KY compared to nearest cities:
(Note: Based on data for all years, including only cities with at least 2,500 fire incidents)
| Paducah: | 1.6 |
 According to the data from the years 2002 - 2018 the average number of fire-related casualties per year is 1. The highest number of injuries - 5 took place in 2004, and the lowest - 0 in 2006. The data has a declining trend.
The average number of casualties per 1,000 fires is 2. This indicator was the highest - 15 in 2004, and the lowest 0 in 2006. The trend for casualties per 1,000 incidents is declining. Compared to the state value the number of casualties per 1,000 fire incidents is much lower.
According to the data from the years 2002 - 2018 the average number of fire-related casualties per year is 1. The highest number of injuries - 5 took place in 2004, and the lowest - 0 in 2006. The data has a declining trend.
The average number of casualties per 1,000 fires is 2. This indicator was the highest - 15 in 2004, and the lowest 0 in 2006. The trend for casualties per 1,000 incidents is declining. Compared to the state value the number of casualties per 1,000 fire incidents is much lower.Casualties per 1,000 incidents in Paducah, KY compared to nearest cities:
(Note: Based on data for all years, including only cities with at least 500 fire incidents)
| Paducah: | 2.9 |
| Metropolis: | 5.4 |
| Calvert City: | 0.0 |
| Benton: | 2.6 |
| Mayfield: | 5.1 |
| Cairo: | 0.0 |
| Murray: | 8.1 |
 28.9% incidents where reported in the morning and 71.1% in the evening. The most fires (15.2%) took place on Saturday, and the least (13.5%) on Sunday.
 According to the 3,766 fires from years 2002 - 2018 most fires (11.7%) took place during March, and the least (6.3%) in May.
 Out of all 14,522 cases reported during the years 2002 - 2018, the most belonged to the categories: Rescue & EMS (42.1%), Fire (25.9%), and Hazardous Condition (9.4%).
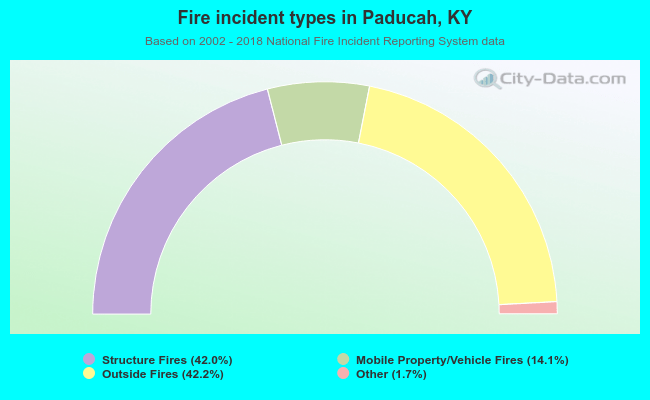 When looking into fire subcategories, the most reports belonged to: Outside Fires (42.2%), and Structure Fires (42.0%).