Ossining: Fire Incidents, New York (NY)
Where are fire incidents reported in Ossining, NY
Something went wrong! Please refresh the page.
|
| |||||||||||||||||||||||||||||||||||||||||||||||||||||||||||||||||||||||||||||||||||||||||||||||||||||||||||||
2003 - 2018 National Fire Incident Reporting System (NFIRS) incidents
- Incident types reported to NFIRS in Ossining, NY
- 1,24736.4%Hazardous Condition
- 89126.0%False Alarm
- 47713.9%Fire
- 34610.1%Good Intent Call
- 2778.1%Service Call
- 1705.0%Rescue & EMS
- 100.3%Severe Weather
- 50.1%Special Incident
- Fire incident types reported to NFIRS in Ossining, NY
- 26154.7%Structure Fires
- 10722.4%Outside Fires
- 6714.0%Mobile Property/Vehicle Fires
- 428.8%Other
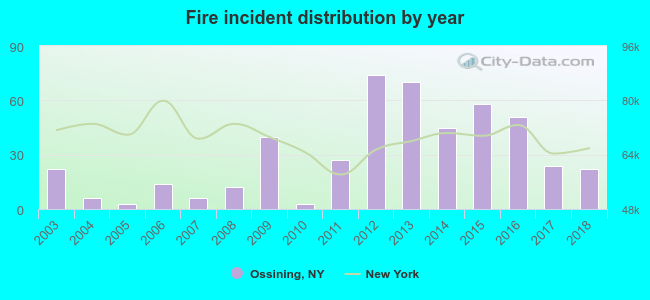 According to the data from the years 2003 - 2018 the average number of fire incidents per year is 30. The highest number of reported fires - 74 took place in 2012, and the least - 3 in 2005. The data has a constant trend.
The average number of yearly fire incidents per 10k residents in Ossining, NY compared to nearest cities:
(Note: Based on data for the last 3 years, including only cities with population 5,000 and above)
| Ossining: | 12.8 |
| Briarcliff Manor: | 10.4 |
| Pleasantville: | 6.3 |
| Congers: | 31.1 |
| New Castle: | 1.1 |
| Sleepy Hollow: | 3.3 |
| Valley Cottage: | 30.4 |
| Nyack: | 3.8 |
| Haverstraw: | 40.0 |
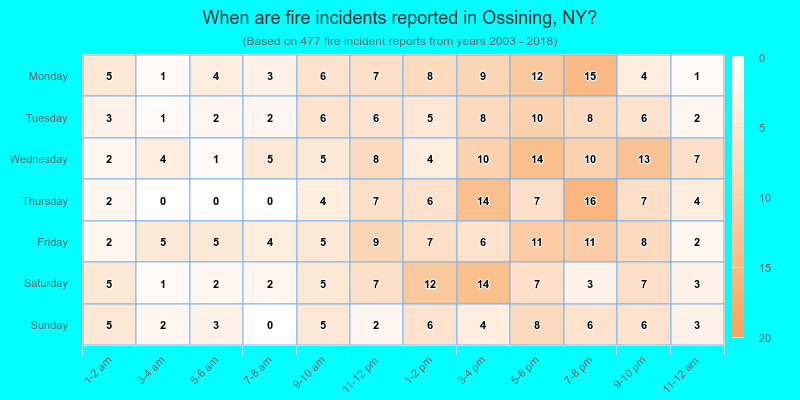
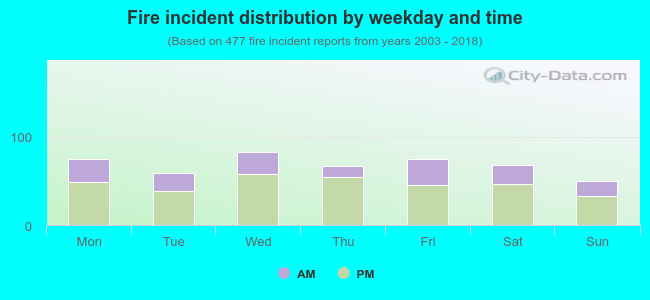 32.1% incidents where reported in the morning and 67.9% in the evening. The most fires (17.4%) took place on Wednesday, and the least (10.5%) on Sunday.
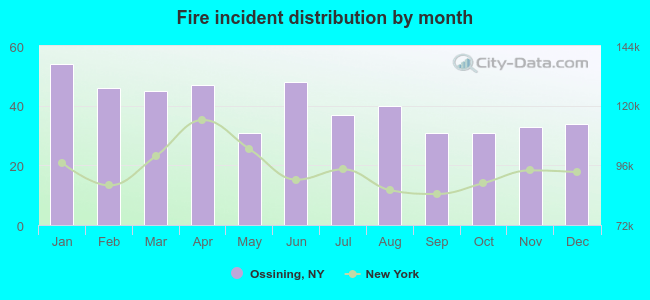 Based on the 477 fires from years 2003 - 2018 most fires (11.3%) took place during January, and the least (6.5%) in May.
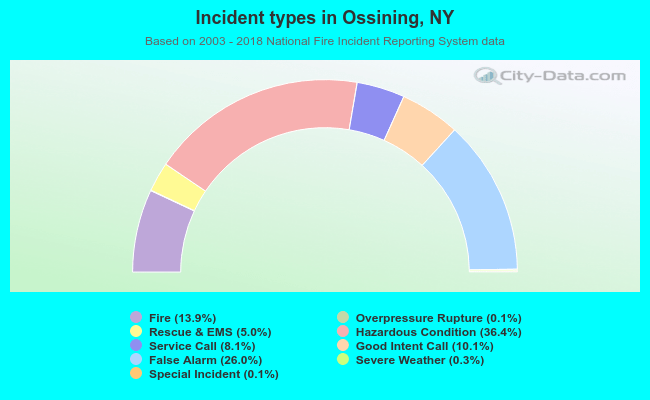 Out of all 3,425 cases reported during the years 2003 - 2018, the most belonged to the categories: Hazardous Condition (36.4%), False Alarm (26.0%), and Fire (13.9%).
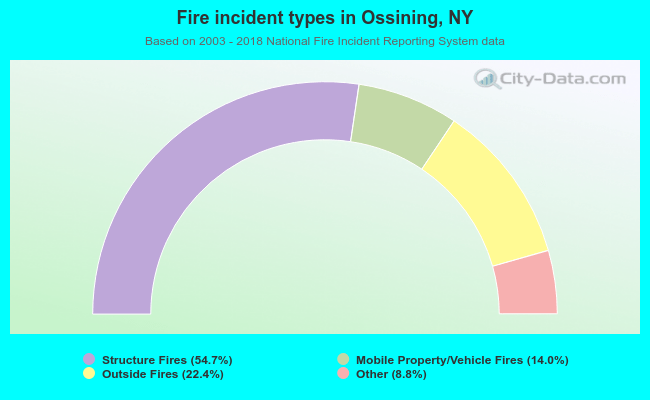 When looking into fire subcategories, the most reports belonged to: Structure Fires (54.7%), and Outside Fires (22.4%).