Nyack: Fire Incidents, New York (NY)
Where are fire incidents reported in Nyack, NY
Something went wrong! Please refresh the page.
|
| |||||||||||||||||||||||||||||||||||||||||||||||||||||||||||||||||||||||||||||||||||||||||||||||||||||||||||||
2002 - 2018 National Fire Incident Reporting System (NFIRS) incidents
- Incident types reported to NFIRS in Nyack, NY
- 64935.9%False Alarm
- 52228.9%Hazardous Condition
- 18410.2%Fire
- 1739.6%Service Call
- 1397.7%Good Intent Call
- 1206.6%Rescue & EMS
- 160.9%Special Incident
- 30.2%Overpressure Rupture
- 30.2%Severe Weather
- Fire incident types reported to NFIRS in Nyack, NY
- 11361.4%Structure Fires
- 3820.7%Outside Fires
- 179.2%Mobile Property/Vehicle Fires
- 168.7%Other
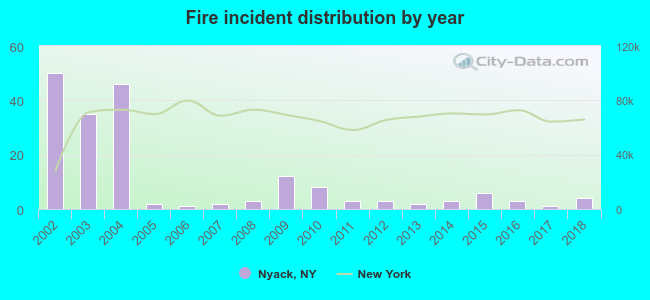 According to the data from the years 2002 - 2018 the average number of fire incidents per year is 11. The highest number of reported fires - 50 took place in 2002, and the least - 1 in 2006. The data has a decreasing trend.
The average number of yearly fire incidents per 10k residents in Nyack, NY compared to nearest cities:
(Note: Based on data for the last 3 years, including only cities with population 5,000 and above)
| Nyack: | 3.8 |
| Valley Cottage: | 30.4 |
| Blauvelt: | 24.6 |
| Sleepy Hollow: | 3.3 |
| Tarrytown: | 8.4 |
| Congers: | 31.1 |
| Tappan: | 32.3 |
| Nanuet: | 24.0 |
| Pearl River: | 18.3 |
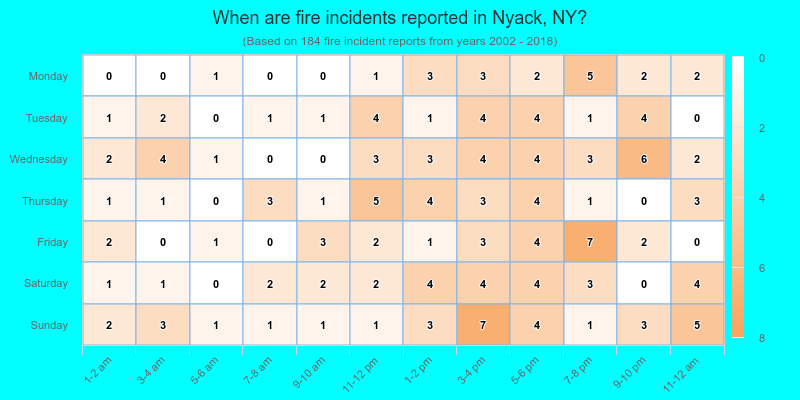
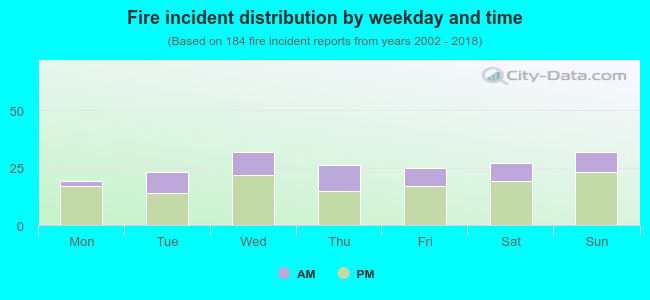 31.0% incidents where reported in the morning and 69.0% in the evening. The most fires (17.4%) took place on Wednesday, and the least (10.3%) on Monday.
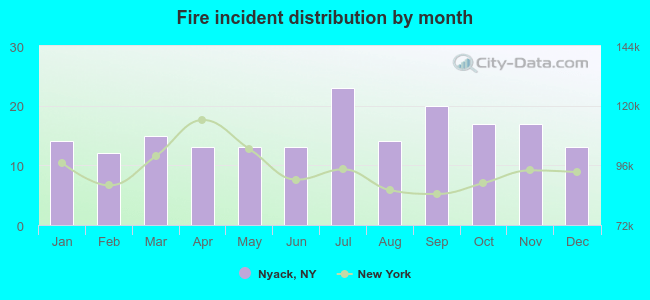 Based on the 184 reports from years 2002 - 2018 most fires (12.5%) took place during July, and the least (6.5%) in February.
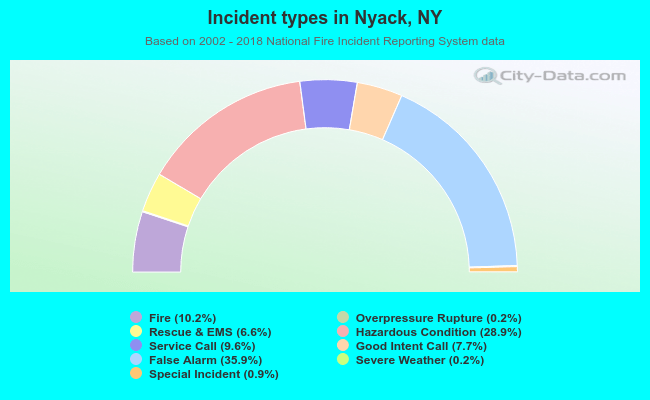 Out of all 1,809 cases reported during the years 2002 - 2018, the most belonged to the categories: False Alarm (35.9%), Hazardous Condition (28.9%), and Fire (10.2%).
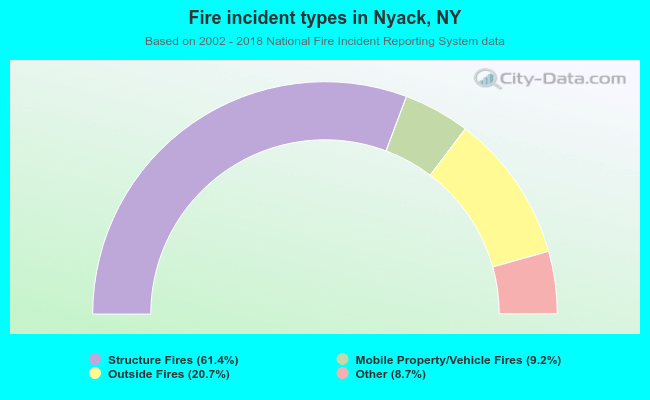 When looking into fire subcategories, the most incidents belonged to: Structure Fires (61.4%), and Outside Fires (20.7%).