Oro Valley: Fire Incidents, Arizona (AZ)
Where are fire incidents reported in Oro Valley, AZ
Something went wrong! Please refresh the page.
|
| |||||||||||||||||||||||||||||||||||||||||||||||||||||||||||||||||||||||||||||||||||||||||||||||||||||||||||||
2004 - 2018 National Fire Incident Reporting System (NFIRS) incidents
- Incident types reported to NFIRS in Oro Valley, AZ
- 17,73157.0%Rescue & EMS
- 10,41733.5%Service Call
- 1,3834.4%Good Intent Call
- 7562.4%False Alarm
- 4131.3%Fire
- 3651.2%Hazardous Condition
- Fire incident types reported to NFIRS in Oro Valley, AZ
- 13833.4%Structure Fires
- 12931.2%Outside Fires
- 8219.9%Other
- 6415.5%Mobile Property/Vehicle Fires
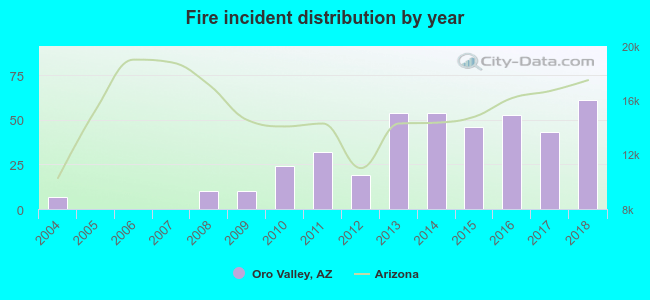 Based on the data from the years 2004 - 2018 the average number of fire incidents per year is 28. The highest number of fires - 61 took place in 2018, and the least - 0 in 2005. The data has a rising trend.
The average number of yearly fire incidents per 10k residents in Oro Valley, AZ compared to nearest cities:
(Note: Based on data for the last 3 years, including only cities with population 5,000 and above)
| Oro Valley: | 12.5 |
| Marana: | 20.6 |
| Saddlebrooke: | 19.4 |
| Tucson: | 43.3 |
| South Tucson: | 40.1 |
| Vail: | 70.2 |
| Sahuarita: | 10.8 |
| Corona de Tucson: | 2.6 |
| Arivaca: | 2.6 |
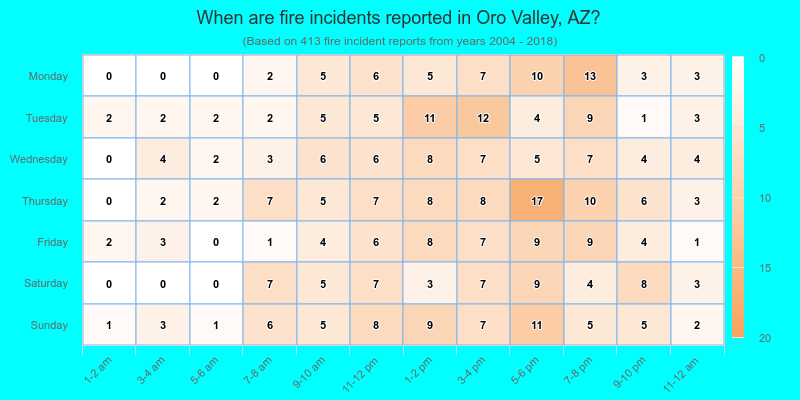
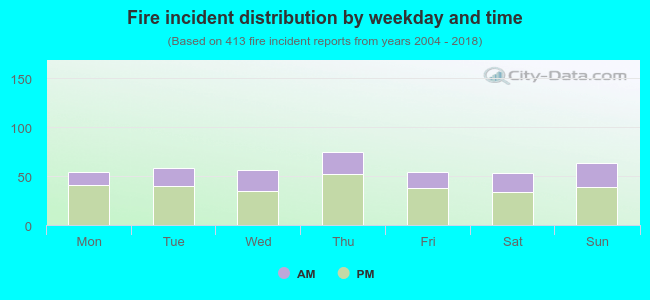 32.4% incidents where reported in the morning and 67.6% in the evening. The most fires (18.2%) took place on Thursday, and the least (12.8%) on Saturday.
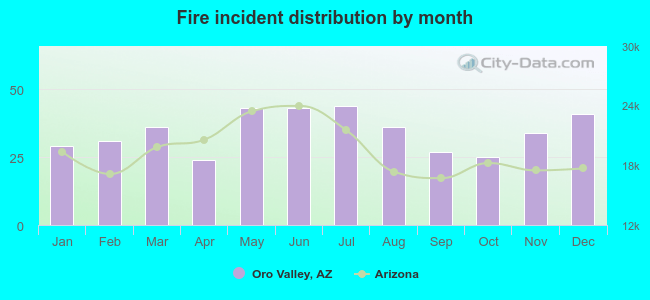 Based on the 413 reports from years 2004 - 2018 most fires (10.7%) took place during July, and the least (5.8%) in April.
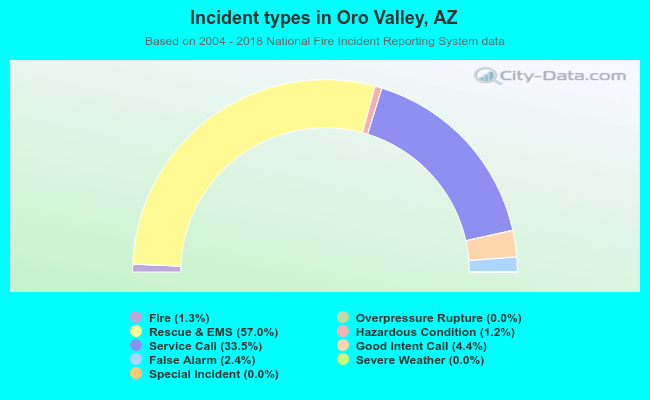 Out of all 31,080 cases reported during the years 2004 - 2018, the most belonged to the categories: Rescue & EMS (57.0%), Service Call (33.5%), and Good Intent Call (4.4%).
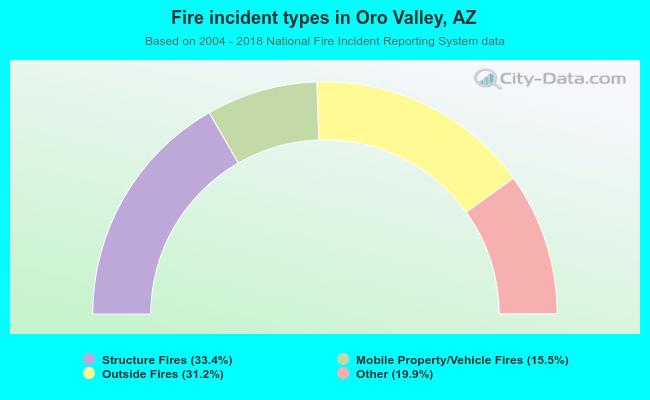 When looking into fire subcategories, the most reports belonged to: Structure Fires (33.4%), and Outside Fires (31.2%).