Sahuarita: Fire Incidents, Arizona (AZ)
Where are fire incidents reported in Sahuarita, AZ
Something went wrong! Please refresh the page.
|
| |||||||||||||||||||||||||||||||||||||||||||||||||||||||||||||||||||||||||||||||||||||||||||||||||||||||||||||
2009 - 2018 National Fire Incident Reporting System (NFIRS) incidents
- Incident types reported to NFIRS in Sahuarita, AZ
- 3,45754.0%Rescue & EMS
- 1,98731.0%Service Call
- 3475.4%Good Intent Call
- 2353.7%Fire
- 2083.2%False Alarm
- 1612.5%Hazardous Condition
- Fire incident types reported to NFIRS in Sahuarita, AZ
- 9038.3%Outside Fires
- 8737.0%Structure Fires
- 4017.0%Mobile Property/Vehicle Fires
- 187.7%Other
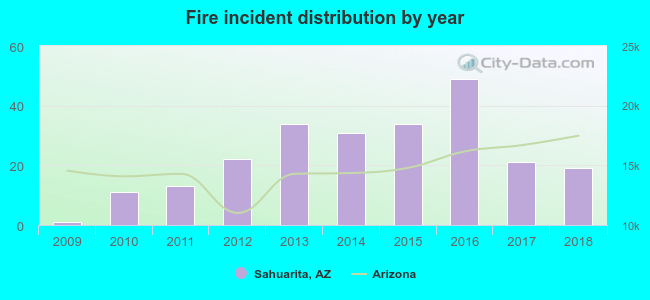 According to the data from the years 2009 - 2018 the average number of fire incidents per year is 24. The highest number of reported fires - 49 took place in 2016, and the least - 1 in 2009. The data has an increasing trend.
The average number of yearly fire incidents per 10k residents in Sahuarita, AZ compared to nearest cities:
(Note: Based on data for the last 3 years, including only cities with population 5,000 and above)
| Sahuarita: | 10.8 |
| Green Valley: | 23.5 |
| Arivaca: | 2.6 |
| Corona de Tucson: | 2.6 |
| Vail: | 70.2 |
| South Tucson: | 40.1 |
| Tucson: | 43.3 |
| Rio Rico: | 6.9 |
| Marana: | 20.6 |
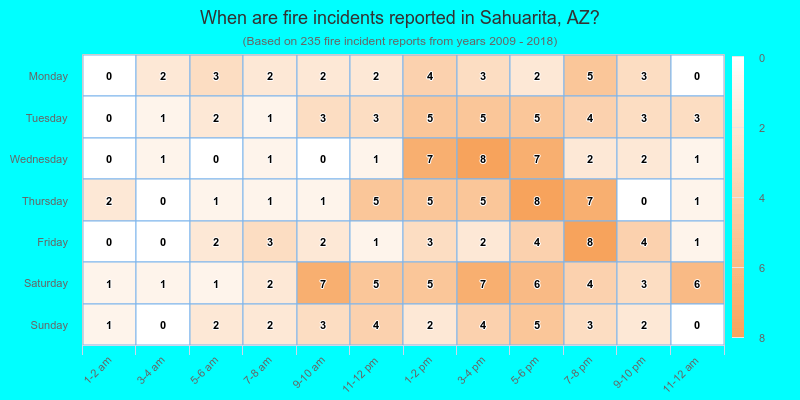
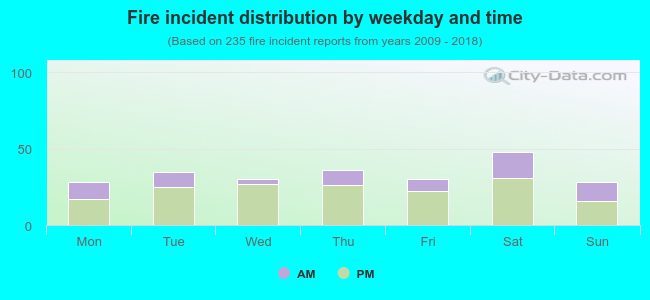 30.2% incidents where reported in the morning and 69.8% in the evening. The most fires (20.4%) took place on Saturday, and the least (11.9%) on Monday.
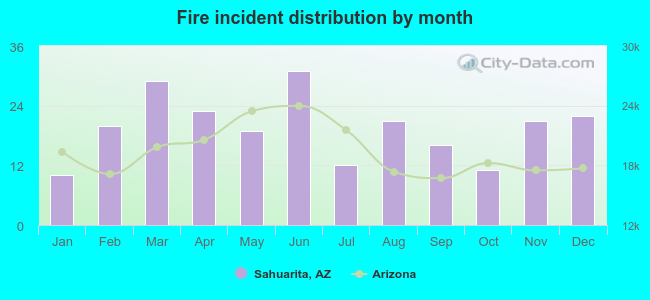 According to the 235 reports from years 2009 - 2018 most fires (13.2%) took place during June, and the least (4.3%) in January.
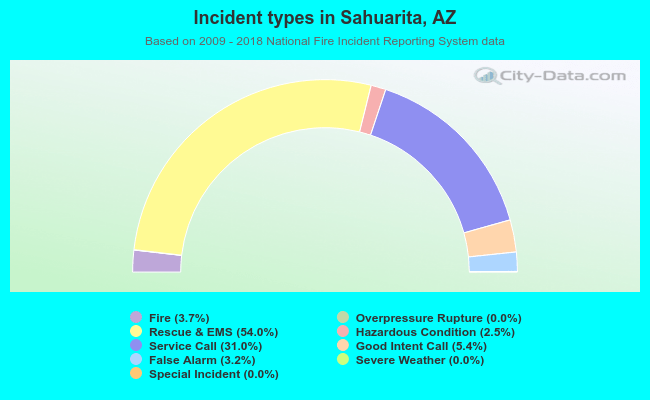 Out of all 6,402 cases reported during the years 2009 - 2018, the most belonged to the categories: Rescue & EMS (54.0%), Service Call (31.0%), and Good Intent Call (5.4%).
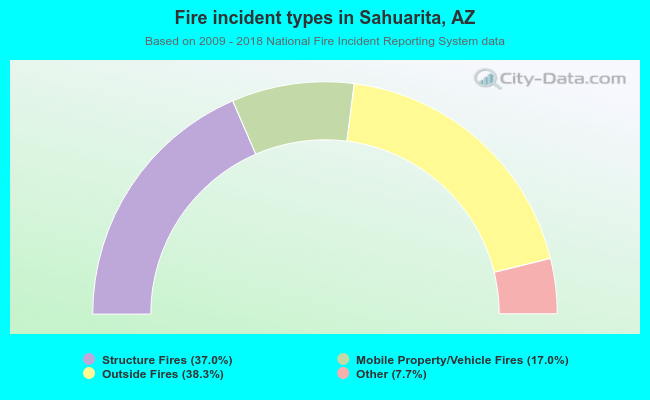 When looking into fire subcategories, the most reports belonged to: Outside Fires (38.3%), and Structure Fires (37.0%).