Omaha: Fire Incidents, Nebraska (NE)
Where are fire incidents reported in Omaha, NE
Something went wrong! Please refresh the page.
| Fire incidents reported | |
|---|---|
| Sreet name | Count |
| 16TH ST | 1,046 |
| 24TH ST | 984 |
| 30TH ST | 816 |
| 72ND ST | 600 |
| 13TH ST | 574 |
| 42ND ST | 532 |
| 20TH ST | 488 |
| 60TH ST | 482 |
| 27TH ST | 468 |
| 18TH ST | 466 |
| 36TH ST | 462 |
| 40TH ST | 462 |
| 29TH ST | 448 |
| 33RD ST | 446 |
| DODGE ST | 440 |
| PARK AVE | 392 |
| 48TH ST | 386 |
| FLORENCE BLVD | 366 |
| 15TH ST | 362 |
| 25TH ST | 352 |
| 14TH ST | 350 |
| 17TH ST | 348 |
| AMES AVE | 344 |
| 90TH ST | 338 |
| 19TH ST | 320 |
| 22ND ST | 308 |
| MAPLE ST | 304 |
| 39TH ST | 302 |
| 37TH ST | 298 |
| 11TH ST | 294 |
| Other | 15,028 |
2002 - 2018 National Fire Incident Reporting System (NFIRS) incidents
- Incident types reported to NFIRS in Omaha, NE
- 171,59164.1%Rescue & EMS
- 28,80610.8%Fire
- 21,1967.9%False Alarm
- 19,7227.4%Service Call
- 15,9736.0%Hazardous Condition
- 9,9353.7%Good Intent Call
- Fire incident types reported to NFIRS in Omaha, NE
- 12,00141.7%Outside Fires
- 10,46636.3%Structure Fires
- 5,92420.6%Mobile Property/Vehicle Fires
- 4151.4%Other
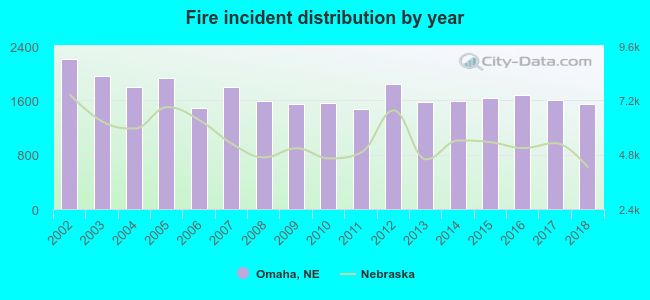 According to the data from the years 2002 - 2018 the average number of fires per year is 1,694. The highest number of fire incidents - 2,214 took place in 2002, and the least - 1,478 in 2011. The data has a decreasing trend.
The average number of yearly fire incidents per 10k residents in Omaha, NE compared to nearest cities:
(Note: Based on data for the last 3 years, including only cities with population 5,000 and above)
| Omaha: | 35.9 |
| Ralston: | 8.3 |
| La Vista: | 3.8 |
| Papillion: | 2.7 |
| Bellevue: | 18.4 |
| Elkhorn: | 1.5 |
| Gretna: | 61.7 |
| Plattsmouth: | 41.1 |
| Blair: | 15.4 |
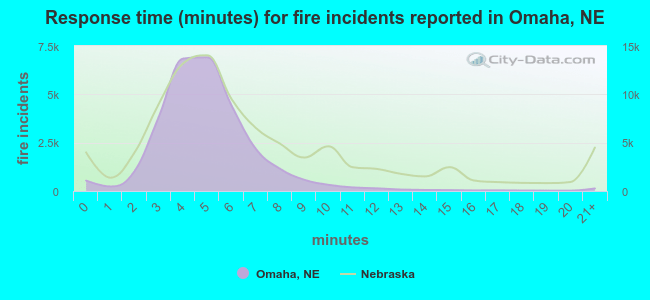 The median response time based on all reported fire incidents is 5 minutes. This is lower compared to the Nebraska median value.
The median response time in Omaha, NE compared to nearest cities:
(Note: Based on data for all years, including only cities with at least 500 fire incidents)
| Omaha: | 5 minutes |
| Boys Town: | 4 minutes |
| Council Bluffs: | 7 minutes |
| Bellevue: | 6 minutes |
| Ashland: | 8 minutes |
| Fremont: | 5 minutes |
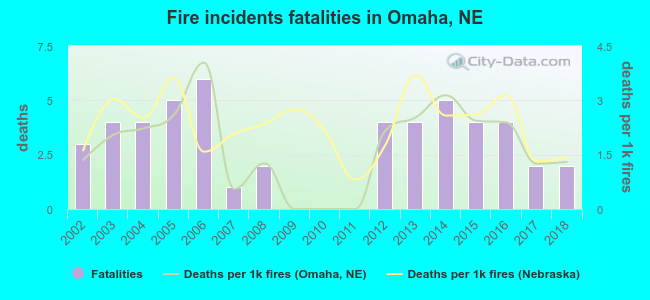 According to the data from the years 2002 - 2018 the average number of fire-related yearly deaths is 3. The highest number of deaths - 6 took place in 2006, and the lowest - 0 in 2009. The data has a decreasing trend.
The average number of deaths per 1,000 fires is 2. This indicator was the highest - 4 in 2006, and the lowest 0 in 2009. The trend for fatalities per 1,000 incidents is dropping. Compared to the state value the number of fatalities per 1,000 fires is lower.
According to the data from the years 2002 - 2018 the average number of fire-related yearly deaths is 3. The highest number of deaths - 6 took place in 2006, and the lowest - 0 in 2009. The data has a decreasing trend.
The average number of deaths per 1,000 fires is 2. This indicator was the highest - 4 in 2006, and the lowest 0 in 2009. The trend for fatalities per 1,000 incidents is dropping. Compared to the state value the number of fatalities per 1,000 fires is lower.Deaths per 1,000 incidents in Omaha, NE compared to nearest cities:
(Note: Based on data for all years, including only cities with at least 2,500 fire incidents)
| Omaha: | 1.7 |
| Council Bluffs: | 3.8 |
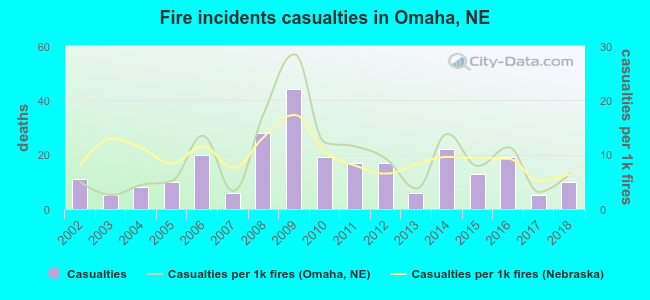 Based on the data from the years 2002 - 2018 the average number of fire-related casualties per year is 15. The highest number of reported casualties - 44 took place in 2009, and the lowest - 5 in 2003. The data has a dropping trend.
The average number of injuries per 1,000 fires is 9. This indicator was the highest - 28 in 2009, and the lowest 3 in 2003. The trend for injuries per 1,000 fires is growing. Compared to the Nebraska value the number of injuries per 1,000 incidents is about the same.
Based on the data from the years 2002 - 2018 the average number of fire-related casualties per year is 15. The highest number of reported casualties - 44 took place in 2009, and the lowest - 5 in 2003. The data has a dropping trend.
The average number of injuries per 1,000 fires is 9. This indicator was the highest - 28 in 2009, and the lowest 3 in 2003. The trend for injuries per 1,000 fires is growing. Compared to the Nebraska value the number of injuries per 1,000 incidents is about the same.Casualties per 1,000 incidents in Omaha, NE compared to nearest cities:
(Note: Based on data for all years, including only cities with at least 500 fire incidents)
| Omaha: | 9.0 |
| Boys Town: | 0.0 |
| Council Bluffs: | 8.9 |
| Bellevue: | 55.9 |
| Ashland: | 0.0 |
| Fremont: | 24.7 |
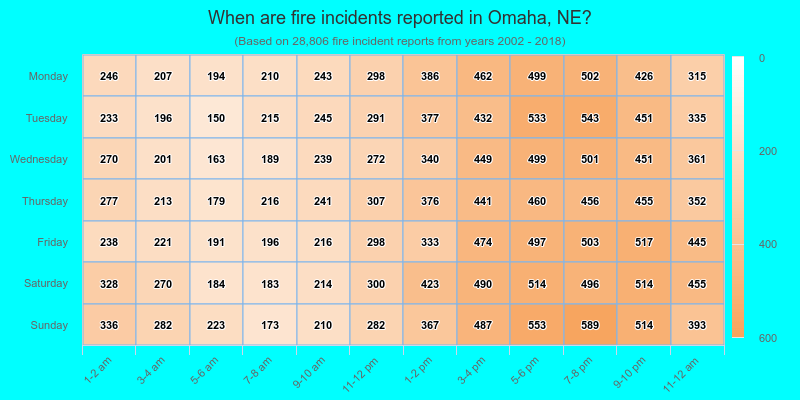
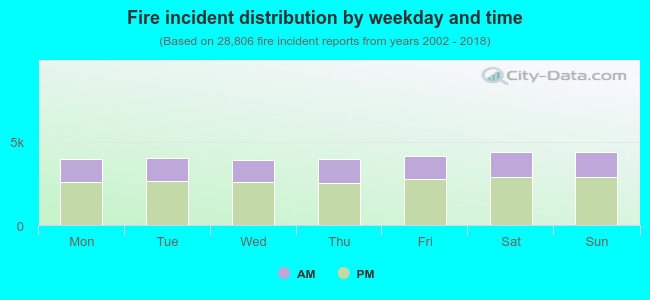 34.2% incidents where reported in the morning and 65.8% in the evening. The most fires (15.3%) took place on Sunday, and the least (13.7%) on Wednesday.
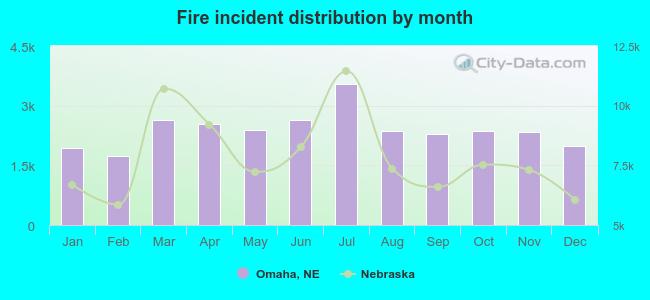 According to the 28,806 fires from years 2002 - 2018 most fires (12.3%) took place during July, and the least (6.0%) in February.
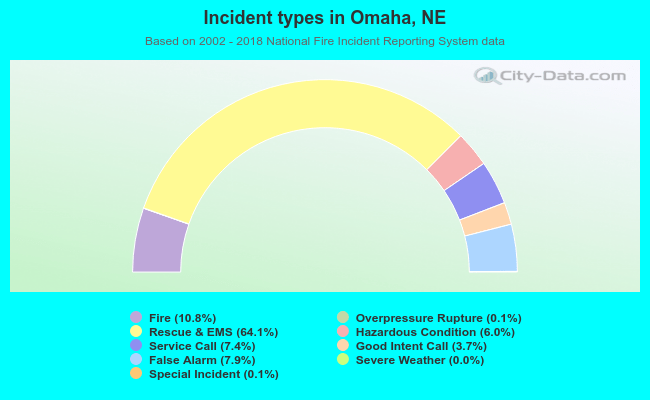 Out of all 267,566 cases reported during the years 2002 - 2018, the most belonged to the categories: Rescue & EMS (64.1%), Fire (10.8%), and False Alarm (7.9%).
 When looking into fire subcategories, the most reports belonged to: Outside Fires (41.7%), and Structure Fires (36.3%).