La Vista: Fire Incidents, Nebraska (NE)
Where are fire incidents reported in La Vista, NE
Something went wrong! Please refresh the page.
|
| |||||||||||||||||||||||||||||||||||||||||||||||||||||||||||||||||||||||||||||||||||||||||||||||||||||||||||||
2004 - 2018 National Fire Incident Reporting System (NFIRS) incidents
- Incident types reported to NFIRS in La Vista, NE
- 1,08967.2%Rescue & EMS
- 18611.5%Fire
- 1227.5%False Alarm
- 915.6%Hazardous Condition
- 664.1%Good Intent Call
- 623.8%Service Call
- 30.2%Special Incident
- Fire incident types reported to NFIRS in La Vista, NE
- 8847.3%Structure Fires
- 5328.5%Outside Fires
- 2714.5%Mobile Property/Vehicle Fires
- 189.7%Other
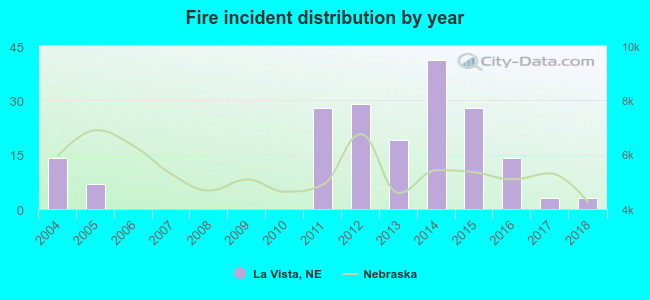 Based on the data from the years 2004 - 2018 the average number of fires per year is 12. The highest number of fire incidents - 41 took place in 2014, and the least - 0 in 2006. The data has a dropping trend.
The average number of yearly fire incidents per 10k residents in La Vista, NE compared to nearest cities:
(Note: Based on data for the last 3 years, including only cities with population 5,000 and above)
| La Vista: | 3.8 |
| Ralston: | 8.3 |
| Papillion: | 2.7 |
| Omaha: | 35.9 |
| Bellevue: | 18.4 |
| Gretna: | 61.7 |
| Elkhorn: | 1.5 |
| Plattsmouth: | 41.1 |
| Blair: | 15.4 |
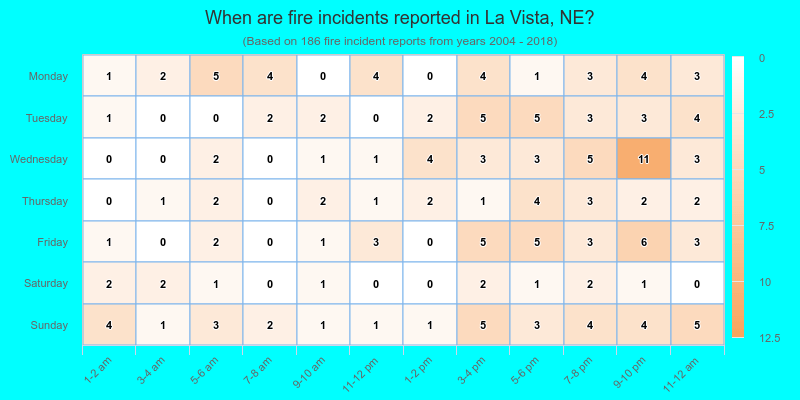
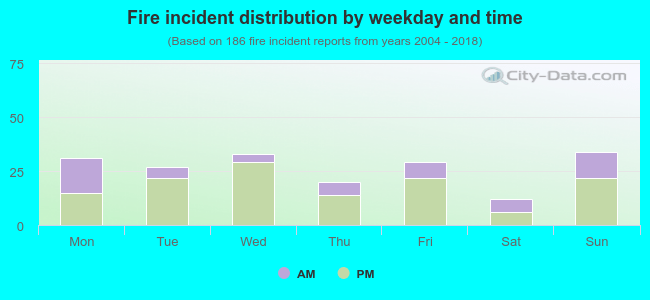 30.1% incidents where reported in the morning and 69.9% in the evening. The most fires (18.3%) took place on Sunday, and the least (6.5%) on Saturday.
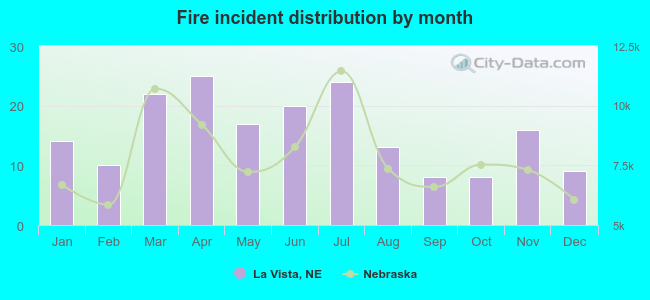 Based on the 186 reports from years 2004 - 2018 most fires (13.4%) took place during April, and the least (4.3%) in September.
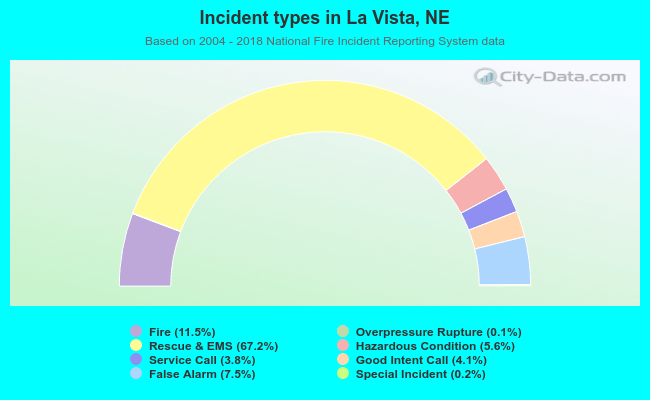 Out of all 1,620 cases reported during the years 2004 - 2018, the most belonged to the categories: Rescue & EMS (67.2%), Fire (11.5%), and False Alarm (7.5%).
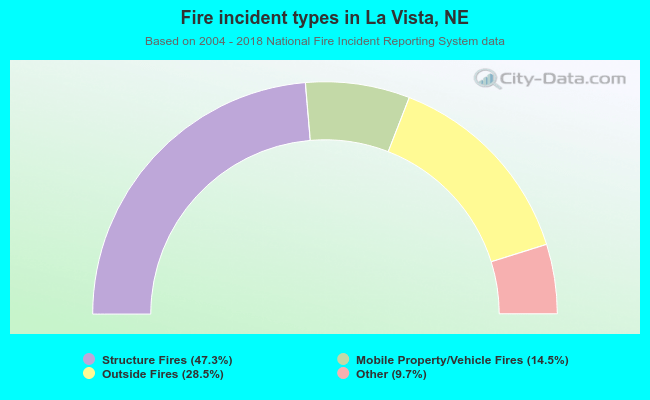 When looking into fire subcategories, the most reports belonged to: Structure Fires (47.3%), and Outside Fires (28.5%).