Ojai: Fire Incidents, California (CA)
Where are fire incidents reported in Ojai, CA
Something went wrong! Please refresh the page.
|
| |||||||||||||||||||||||||||||||||||||||||||||||||||||||||||||||||||||||||||||||||||||||||||||||||||||||||||||
2005 - 2018 National Fire Incident Reporting System (NFIRS) incidents
- Incident types reported to NFIRS in Ojai, CA
- 3,19759.5%Rescue & EMS
- 57010.6%Good Intent Call
- 4979.2%Service Call
- 4137.7%Fire
- 3937.3%Hazardous Condition
- 2815.2%False Alarm
- 120.2%Severe Weather
- 70.1%Overpressure Rupture
- 60.1%Special Incident
- Fire incident types reported to NFIRS in Ojai, CA
- 14936.1%Outside Fires
- 13833.4%Structure Fires
- 8219.9%Other
- 4410.7%Mobile Property/Vehicle Fires
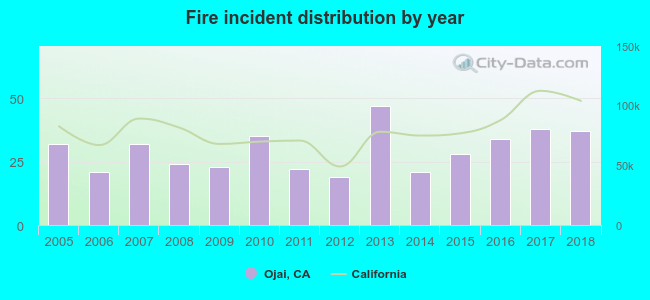 Based on the data from the years 2005 - 2018 the average number of fires per year is 30. The highest number of reported fire incidents - 47 took place in 2013, and the least - 19 in 2012. The data has a rising trend.
The average number of yearly fire incidents per 10k residents in Ojai, CA compared to nearest cities:
(Note: Based on data for the last 3 years, including only cities with population 5,000 and above)
| Ojai: | 47.6 |
| Mira Monte: | 4.4 |
| Ventura: | 37.4 |
| Santa Paula: | 24.2 |
| El Rio: | 43.5 |
| Carpinteria: | 21.2 |
| Oxnard: | 24.6 |
| Fillmore: | 25.1 |
| Camarillo: | 17.4 |
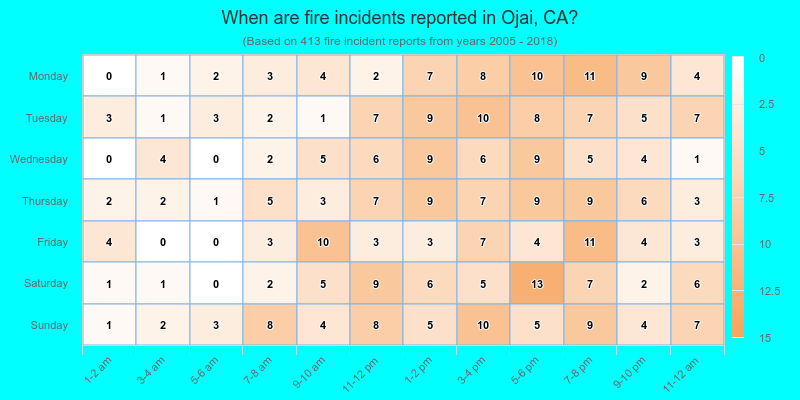
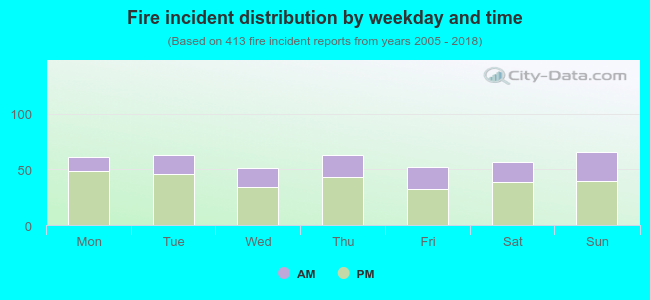 31.5% incidents where reported in the morning and 68.5% in the evening. The most fires (16.0%) took place on Sunday, and the least (12.3%) on Wednesday.
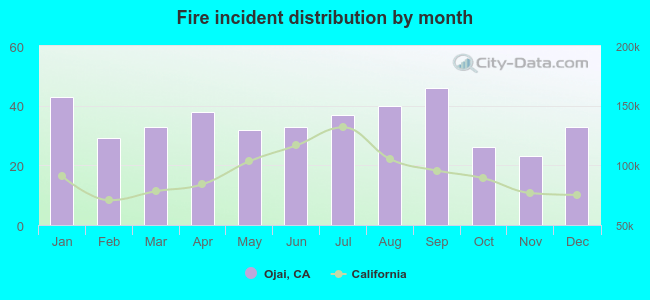 According to the 413 fire incidents from years 2005 - 2018 most fires (11.1%) took place during September, and the least (5.6%) in November.
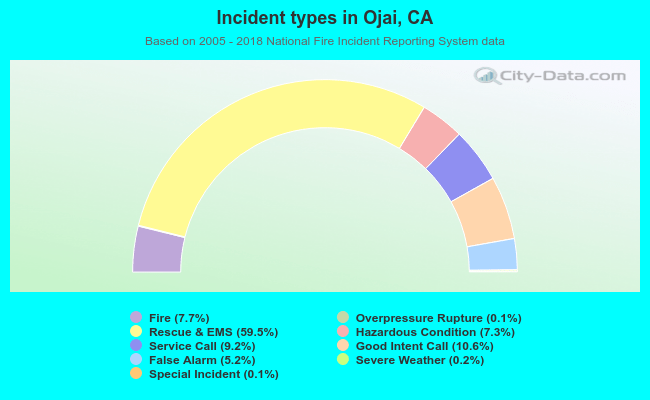 Out of all 5,376 cases reported during the years 2005 - 2018, the most belonged to the categories: Rescue & EMS (59.5%), Good Intent Call (10.6%), and Service Call (9.2%).
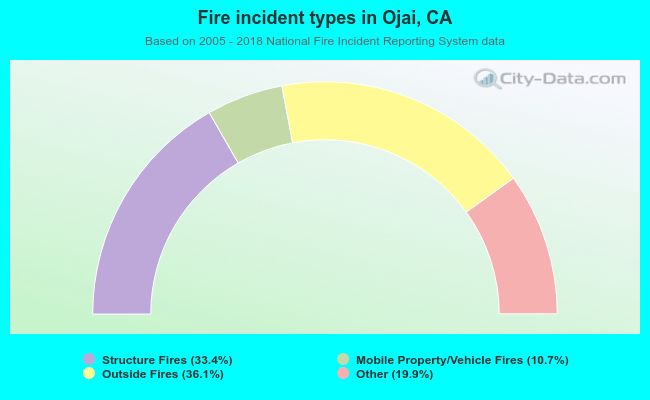 When looking into fire subcategories, the most reports belonged to: Outside Fires (36.1%), and Structure Fires (33.4%).