| Fire incidents reported |
|---|
| Sreet name | Count |
|---|
| GARRETT HIGHWAY HWY | 64 | | OAKLAND SANG RUN ROAD RD | 30 | | HUTTON ROAD RD | 26 | | GORMAN RD | 20 | | MARYLAND HIGHWAY HWY | 20 | | OAK STREET ST | 20 | | GARRETT HIGHWAY | 18 | | GEORGE WASHINGTON HIGHWAY | 18 | | GEORGE WASHINGTON HWY | 18 | | GEORGE WASHINGTON HWY | 16 | | GEORGE WASHINGTON HIGHWAY HWY | 14 | | GORMAN ROAD RD | 14 | | LIBERTY STREET ST | 14 | | SUNNYSIDE ROAD RD | 14 | | A STREET ST | 12 | | DENNETT ROAD RD | 12 | | B STREET ST | 10 | | COZY PINE LN | 10 | | FINGERBOARD ROAD RD | 10 | | MEMORIAL DRIVE | 10 | | OAKLAND SANG RUN ROAD | 10 | | P ST | 10 | | PLEASANT VALLEY ROAD RD | 10 | | SANDERS LANE | 10 | | TABLE ROCK RD | 10 |
| | | Fire incidents reported |
|---|
| Sreet name | Count |
|---|
| THIRD STREET ST | 10 | | UNDERWOOD ROAD RD | 10 | | WHITE CHURCH STEYER RD | 10 | | ALDER STREET ST | 8 | | BETHLEHEM RD | 8 | | CRELLIN MINE RD | 8 | | FOURTH STREET ST | 8 | | GARRETT ROAD RD | 8 | | GLENDALE ROAD | 8 | | HERRINGTON MANOR ROAD RD | 8 | | HIGHVIEW DRIVE DR | 8 | | K STREET ST | 8 | | MAYHEW INN ROAD RD | 8 | | MEMORIAL DRIVE DR | 8 | | NEST LICK ACRES RD | 8 | | PAUL FRIEND RD | 8 | | SECOND STREET ST | 8 | | SNOWY CREEK ROAD RD | 8 | | STEYER MINE RD | 8 | | STEYER GORMAN ROAD | 8 | | STEYER MINE RD | 8 | | UNKOWN STREET/HIGHWAY | 8 | | BLUE RIBBON RD | 6 | | BOYSCOUT RD | 6 | | |
|
 Based on the data from the years 2003 - 2018 the average number of fires per year is 48. The highest number of reported fire incidents - 107 took place in 2003, and the least - 10 in 2007. The data has a decreasing trend.
 The median response time based on all reported fire incidents is 14 minutes. This is higher than the Maryland median value.
 37.0% incidents where reported in the morning and 63.0% in the evening. The most fires (16.8%) took place on Saturday, and the least (12.5%) on Tuesday.
 According to the 770 reports from years 2003 - 2018 most fires (14.5%) took place during April, and the least (5.8%) in September.
 Out of all 2,751 cases reported during the years 2003 - 2018, the most belonged to the categories: Fire (28.0%), Rescue & EMS (26.3%), and Hazardous Condition (17.2%).
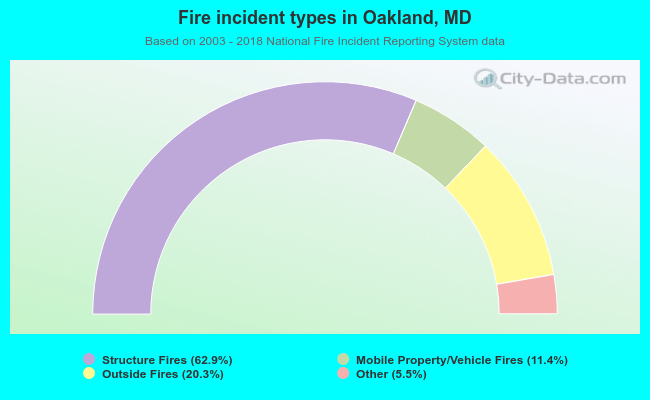 When looking into fire subcategories, the most incidents belonged to: Structure Fires (62.9%), and Outside Fires (20.3%).