| Fire incidents reported |
|---|
| Sreet name | Count |
|---|
| MARYLAND HWY | 38 | | GARRETT HWY | 32 | | MARYLAND HIGHWAY | 28 | | SWANTON RD | 20 | | HUTTON RD | 16 | | PYSELL CROSSCUT RD | 16 | | OAKLAND SANG RUN RD | 14 | | MAIN ST | 12 | | PLEASANT VALLEY RD | 12 | | BETHLEHEM RD | 10 | | GEORGE WASHINGTON HWY | 10 | | ALDER ST | 8 | | BITTINGER RD | 8 | | CHESTNUT GROVE RD | 8 | | N ST | 8 | | O'BRIEN RD | 8 | | OAK ST | 8 | | SPRING GLADE RD | 8 | | STEYER MINE RD | 8 | | TRUESDALE RD | 8 | | WALNUT BOTTOM RD | 8 | | ALPINE LAKE RD | 6 | | BOY SCOUT RD | 6 | | BROADFORD RD | 6 | | DRY RUN RD | 6 |
| | | Fire incidents reported |
|---|
| Sreet name | Count |
|---|
| FIRST AVE | 6 | | GARRETT RD | 6 | | GORMAN RD | 6 | | GREEN GLADE RD | 6 | | HIGH ST | 6 | | LOWER WHITE OAK DR | 6 | | NEST LICK ACRES RD | 6 | | OLD CRELLIN RD | 6 | | OVERLOOK DR | 6 | | SANG RUN RD | 6 | | SECOND ST | 6 | | SILVER KNOB RD | 6 | | SPRING LN | 6 | | STEIDING CHURCH RD | 6 | | THIRD ST | 6 | | TURKEY NECK RD | 6 | | UNDERWOOD RD | 6 | | 940 PYSELL CROSSCUT ROAD | 4 | | B ST | 4 | | BAKER FARM RD | 4 | | BLUE RIBBON RD | 4 | | BOILING SPRINGS RD | 4 | | BOILING SPRINGS ROAD | 4 | | CARL HARVEY RD | 4 | | CORRINTH WV | 4 |
|
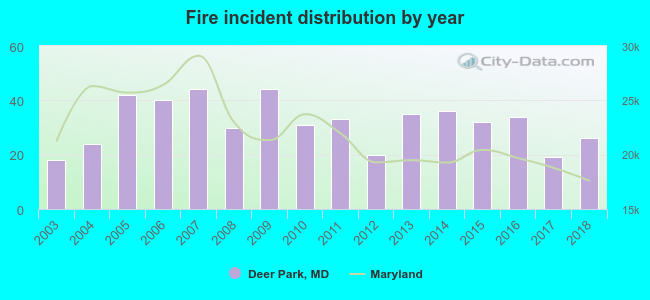 According to the data from the years 2003 - 2018 the average number of fire incidents per year is 32. The highest number of reported fire incidents - 44 took place in 2007, and the least - 18 in 2003. The data has a growing trend.
 The median response time based on all reported fire incidents is 13 minutes. This is higher compared to the state median value.
 35.2% incidents where reported in the morning and 64.8% in the evening. The most fires (16.3%) took place on Monday, and the least (12.2%) on Tuesday.
 Based on the 508 incident reports from years 2003 - 2018 most fires (14.8%) took place during April, and the least (4.1%) in June.
 Out of all 1,444 cases reported during the years 2003 - 2018, the most belonged to the categories: Fire (35.2%), Service Call (23.3%), and Overpressure Rupture (20.2%).
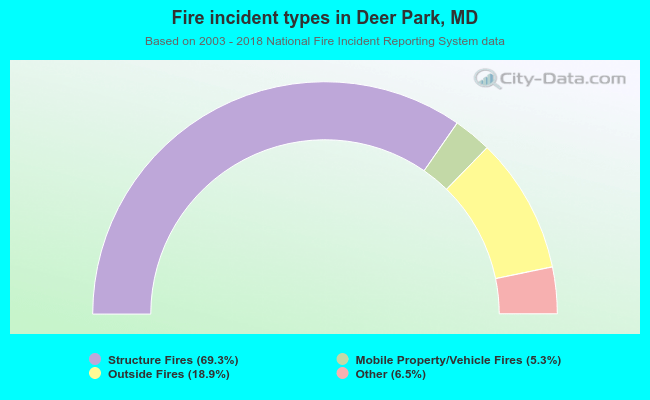 When looking into fire subcategories, the most reports belonged to: Structure Fires (69.3%), and Outside Fires (18.9%).