Norwalk: Fire Incidents, California (CA)
Where are fire incidents reported in Norwalk, CA
Something went wrong! Please refresh the page.
| Fire incidents reported | |
|---|---|
| Sreet name | Count |
| FIRESTONE | 200 |
| PIONEER | 164 |
| IMPERIAL | 118 |
| ROSECRANS | 110 |
| STUDEBAKER | 104 |
| NORWALK | 86 |
| ALONDRA | 76 |
| SAN ANTONIO | 66 |
| EXCELSIOR | 46 |
| BLOOMFIELD | 38 |
| FOSTER | 32 |
| MAPLEDALE | 30 |
| ROSECRANS AV605 | 30 |
| BARNWALL | 26 |
| FERINA | 26 |
| SHOEMAKER | 26 |
| FIRESTONE BLVD605 | 24 |
| KALNOR | 24 |
| SPROUL | 24 |
| GRAYSTONE | 22 |
| EB 105 WO 605 | 20 |
| HOXIE | 20 |
| JERSEY | 20 |
| CHESHIRE | 18 |
| CLARKDALE | 18 |
| FLALLON | 18 |
| FRONT | 18 |
| GRIDLEY | 18 |
| HAYFORD | 18 |
| LEIBACHER | 18 |
2005 - 2018 National Fire Incident Reporting System (NFIRS) incidents
- Incident types reported to NFIRS in Norwalk, CA
- 20,67558.5%Rescue & EMS
- 7,95522.5%Good Intent Call
- 3,91611.1%False Alarm
- 1,4414.1%Fire
- 7192.0%Hazardous Condition
- 5921.7%Service Call
- Fire incident types reported to NFIRS in Norwalk, CA
- 59541.3%Outside Fires
- 37325.9%Structure Fires
- 36625.4%Mobile Property/Vehicle Fires
- 1077.4%Other
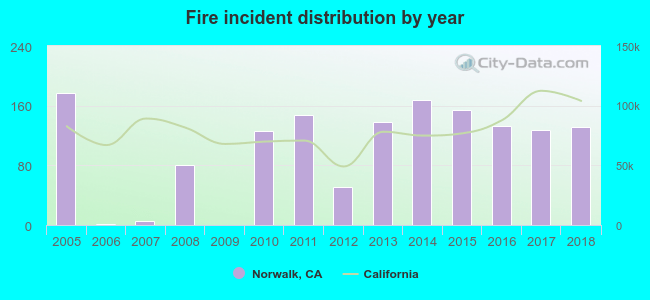 According to the data from the years 2005 - 2018 the average number of fires per year is 103. The highest number of reported fires - 177 took place in 2005, and the least - 0 in 2009. The data has a declining trend.
The average number of yearly fire incidents per 10k residents in Norwalk, CA compared to nearest cities:
(Note: Based on data for the last 3 years, including only cities with population 5,000 and above)
| Norwalk: | 12.2 |
| Santa Fe Springs: | 47.1 |
| Artesia: | 14.4 |
| Cerritos: | 14.6 |
| Bellflower: | 19.1 |
| Downey: | 13.6 |
| La Mirada: | 7.6 |
| La Palma: | 7.8 |
| Lakewood: | 12.0 |
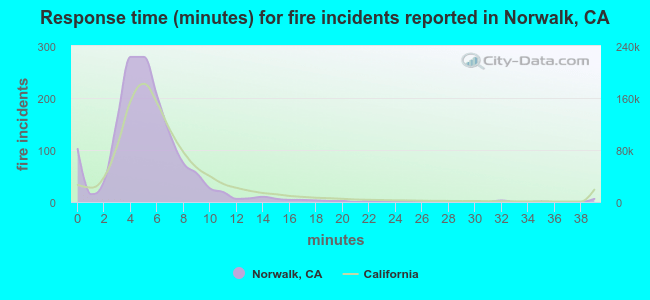 The median response time based on all reported fire incidents is 5 minutes. This is lower than the state median value.
The median response time in Norwalk, CA compared to nearest cities:
(Note: Based on data for all years, including only cities with at least 500 fire incidents)
| Norwalk: | 5 minutes |
| Santa Fe Springs: | 7 minutes |
| Cerritos: | 5 minutes |
| Bellflower: | 4 minutes |
| Downey: | 7 minutes |
| La Mirada: | 5 minutes |
| Lakewood: | 4 minutes |
| Paramount: | 5 minutes |
| Whittier: | 4 minutes |
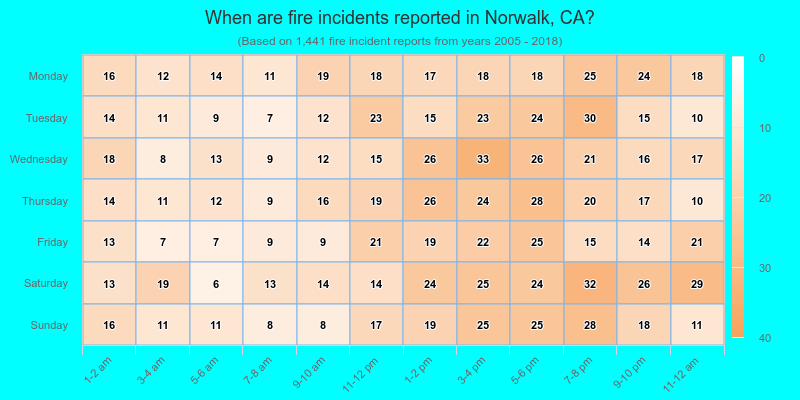
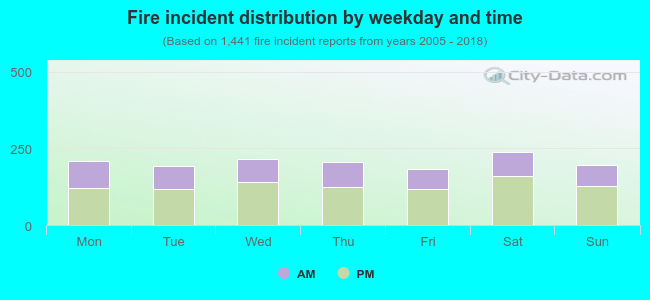 37.3% incidents where reported in the morning and 62.7% in the evening. The most fires (16.6%) took place on Saturday, and the least (12.6%) on Friday.
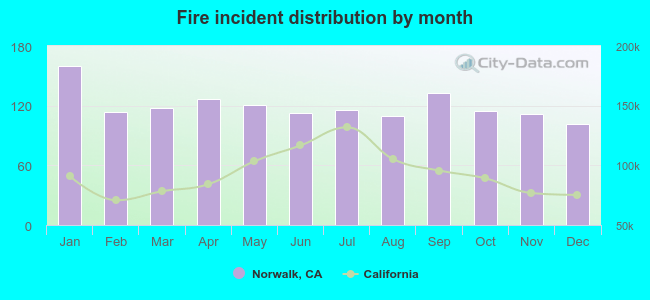 According to the 1,441 incident reports from years 2005 - 2018 most fires (11.1%) took place during January, and the least (7.1%) in December.
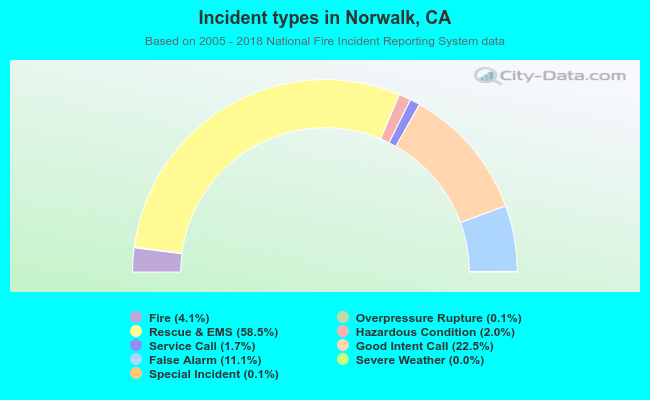 Out of all 35,351 cases reported during the years 2005 - 2018, the most belonged to the categories: Rescue & EMS (58.5%), Good Intent Call (22.5%), and False Alarm (11.1%).
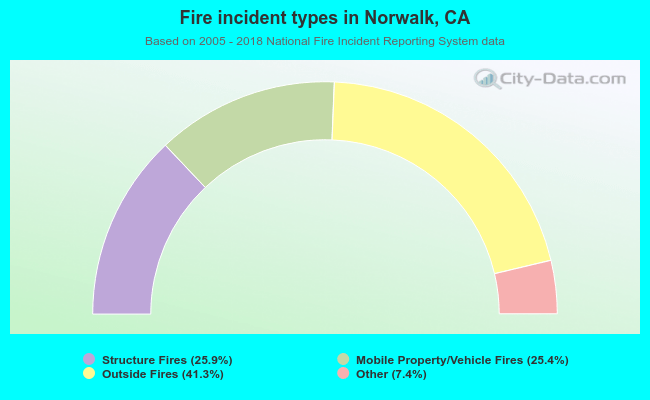 When looking into fire subcategories, the most reports belonged to: Outside Fires (41.3%), and Structure Fires (25.9%).