La Palma: Fire Incidents, California (CA)
Where are fire incidents reported in La Palma, CA
Something went wrong! Please refresh the page.
|
| |||||||||||||||||||||||||||||||||||||||||||||||||||||||||||||||||||||||||||||||||||||||||||||||||||||||||||||
2005 - 2018 National Fire Incident Reporting System (NFIRS) incidents
- Incident types reported to NFIRS in La Palma, CA
- 3,71777.6%Rescue & EMS
- 3216.7%Good Intent Call
- 2475.2%Service Call
- 1883.9%False Alarm
- 1843.8%Fire
- 1252.6%Hazardous Condition
- Fire incident types reported to NFIRS in La Palma, CA
- 6937.5%Outside Fires
- 6334.2%Structure Fires
- 3116.8%Mobile Property/Vehicle Fires
- 2111.4%Other
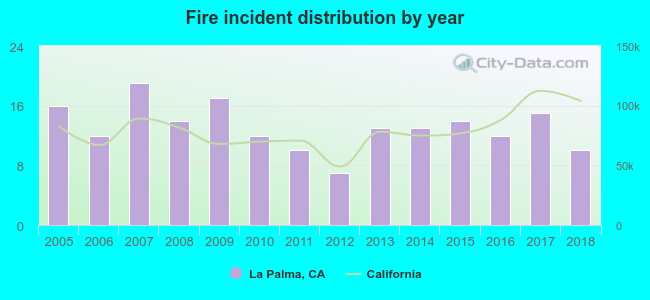 Based on the data from the years 2005 - 2018 the average number of fire incidents per year is 13. The highest number of fires - 19 took place in 2007, and the least - 7 in 2012. The data has a dropping trend.
The average number of yearly fire incidents per 10k residents in La Palma, CA compared to nearest cities:
(Note: Based on data for the last 3 years, including only cities with population 5,000 and above)
| La Palma: | 7.8 |
| Cerritos: | 14.6 |
| Cypress: | 8.7 |
| Hawaiian Gardens: | 20.8 |
| Buena Park: | 14.2 |
| Artesia: | 14.4 |
| Los Alamitos: | 16.2 |
| La Mirada: | 7.6 |
| Stanton: | 12.4 |
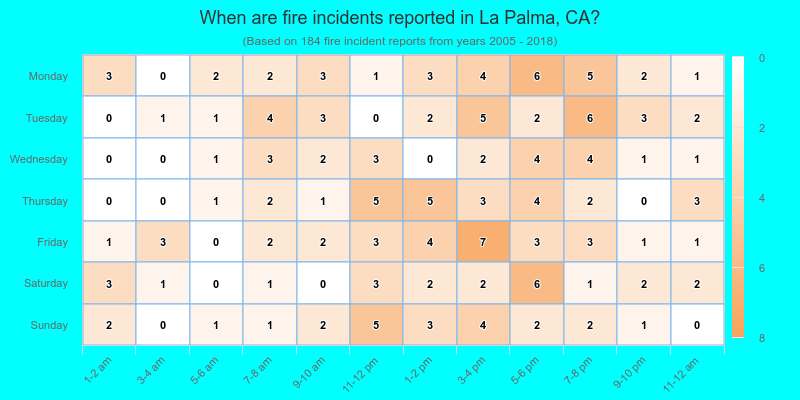
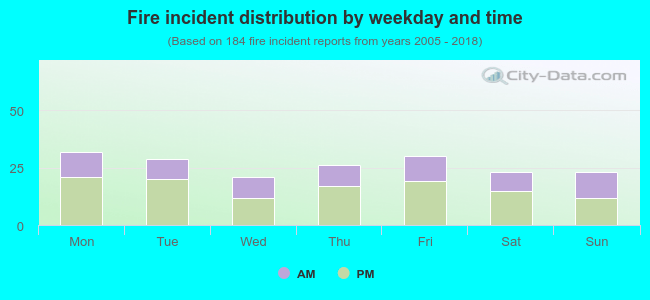 37.0% incidents where reported in the morning and 63.0% in the evening. The most fires (17.4%) took place on Monday, and the least (11.4%) on Wednesday.
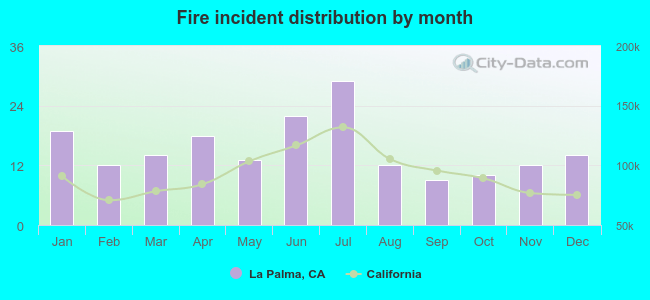 Based on the 184 fire incidents from years 2005 - 2018 most fires (15.8%) took place during July, and the least (4.9%) in September.
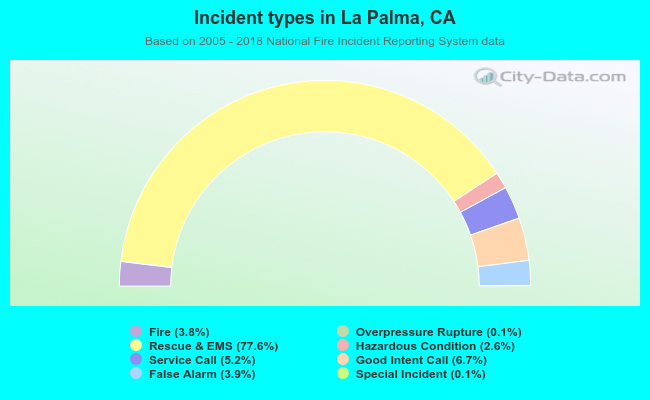 Out of all 4,788 cases reported during the years 2005 - 2018, the most belonged to the categories: Rescue & EMS (77.6%), Good Intent Call (6.7%), and Service Call (5.2%).
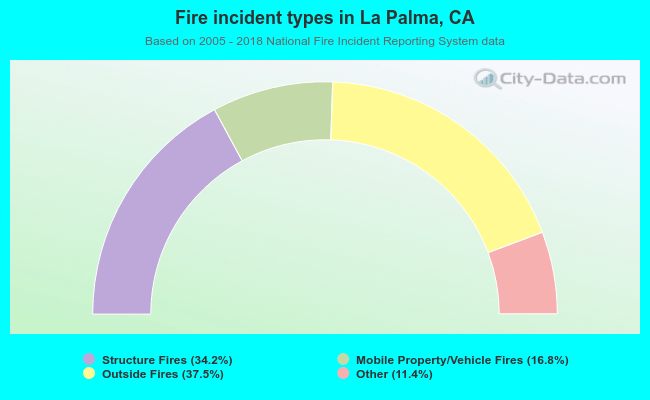 When looking into fire subcategories, the most incidents belonged to: Outside Fires (37.5%), and Structure Fires (34.2%).