Hawaiian Gardens: Fire Incidents, California (CA)
Where are fire incidents reported in Hawaiian Gardens, CA
Something went wrong! Please refresh the page.
|
| |||||||||||||||||||||||||||||||||||||||||||||||||||||||||||||||||||||||||||||||||||||||||||||||||
2005 - 2018 National Fire Incident Reporting System (NFIRS) incidents
- Incident types reported to NFIRS in Hawaiian Gardens, CA
- 3,24072.6%Rescue & EMS
- 54312.2%Good Intent Call
- 2655.9%Fire
- 2114.7%False Alarm
- 1042.3%Hazardous Condition
- 902.0%Service Call
- 50.1%Overpressure Rupture
- Fire incident types reported to NFIRS in Hawaiian Gardens, CA
- 11242.3%Outside Fires
- 9234.7%Structure Fires
- 4316.2%Mobile Property/Vehicle Fires
- 186.8%Other
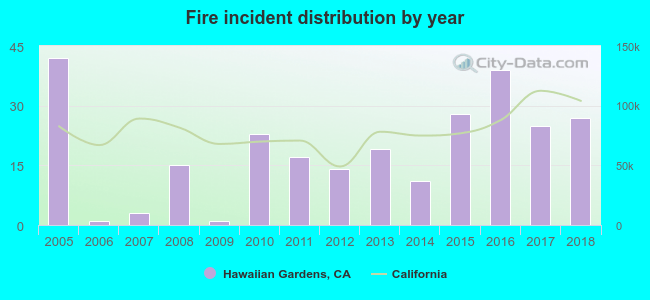 Based on the data from the years 2005 - 2018 the average number of fires per year is 19. The highest number of fires - 42 took place in 2005, and the least - 1 in 2006. The data has a dropping trend.
The average number of yearly fire incidents per 10k residents in Hawaiian Gardens, CA compared to nearest cities:
(Note: Based on data for the last 3 years, including only cities with population 5,000 and above)
| Hawaiian Gardens: | 20.8 |
| Los Alamitos: | 16.2 |
| Cypress: | 8.7 |
| La Palma: | 7.8 |
| Artesia: | 14.4 |
| Rossmoor: | 2.3 |
| Cerritos: | 14.6 |
| Lakewood: | 12.0 |
| Buena Park: | 14.2 |
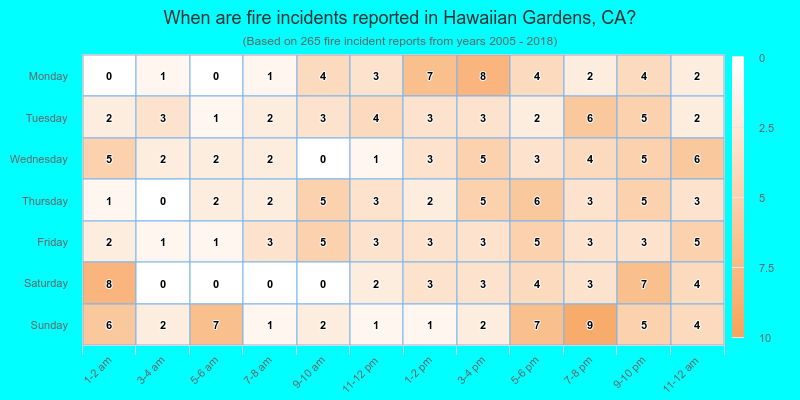
 35.1% incidents where reported in the morning and 64.9% in the evening. The most fires (17.7%) took place on Sunday, and the least (12.8%) on Saturday.
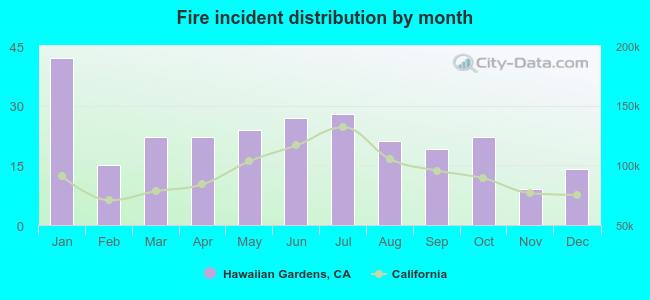 Based on the 265 fire incidents from years 2005 - 2018 most fires (15.8%) took place during January, and the least (3.4%) in November.
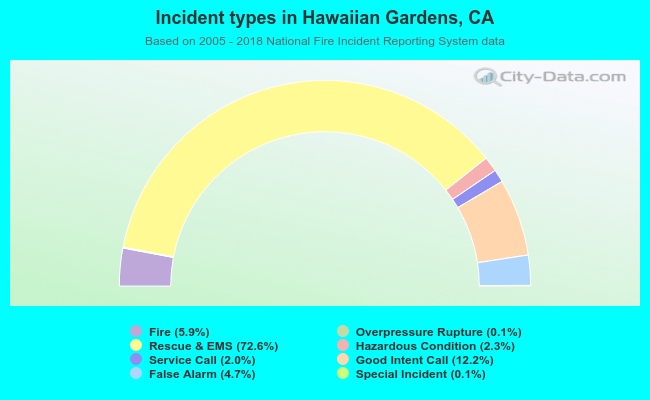 Out of all 4,461 cases reported during the years 2005 - 2018, the most belonged to the categories: Rescue & EMS (72.6%), Good Intent Call (12.2%), and Fire (5.9%).
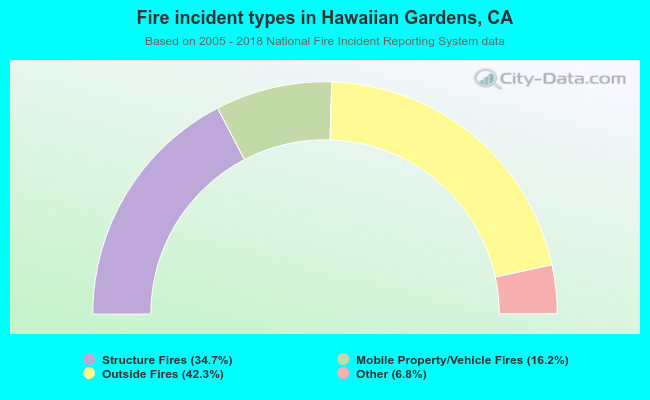 When looking into fire subcategories, the most incidents belonged to: Outside Fires (42.3%), and Structure Fires (34.7%).