Newport: Fire Incidents, Kentucky (KY)
Where are fire incidents reported in Newport, KY
Something went wrong! Please refresh the page.
| Fire incidents reported | |
|---|---|
| Sreet name | Count |
| MONMOUTH ST | 200 |
| PAVILION PKY | 184 |
| TENTH ST | 94 |
| CAROTHERS RD | 82 |
| GRAND AVE | 74 |
| THIRD ST | 68 |
| RIVERBOAT ROW | 66 |
| SIXTH ST | 60 |
| YORK ST | 54 |
| LEVEE WAY | 46 |
| NINTH ST | 46 |
| CENTRAL AVE | 44 |
| COLUMBIA ST | 44 |
| FIFTH ST | 44 |
| ANN ST | 42 |
| FOURTH ST | 42 |
| SARATOGA ST | 42 |
| THIRTEENTH ST | 42 |
| TWELFTH ST | 42 |
| PARK AVE | 38 |
| EIGHTH ST | 36 |
| ISABELLA ST | 36 |
| BRIGHTON ST | 34 |
| ELEVENTH ST | 32 |
| WASHINGTON AVE | 32 |
| LINDSEY ST | 28 |
| BLUEGRASS AVE | 26 |
| SEVENTH ST | 26 |
| I-471 | 24 |
| LIBERTY ST | 24 |
2002 - 2018 National Fire Incident Reporting System (NFIRS) incidents
- Incident types reported to NFIRS in Newport, KY
- 3,81547.9%Rescue & EMS
- 1,18714.9%Fire
- 1,10013.8%Hazardous Condition
- 92411.6%False Alarm
- 4856.1%Service Call
- 3985.0%Good Intent Call
- 270.3%Severe Weather
- 130.2%Overpressure Rupture
- 100.1%Special Incident
- Fire incident types reported to NFIRS in Newport, KY
- 59650.2%Outside Fires
- 37631.7%Structure Fires
- 17414.7%Mobile Property/Vehicle Fires
- 413.5%Other
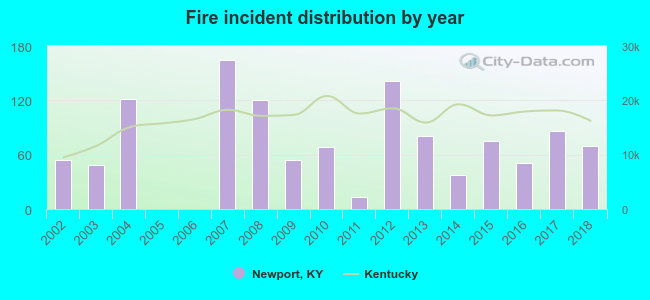 According to the data from the years 2002 - 2018 the average number of fires per year is 70. The highest number of reported fire incidents - 165 took place in 2007, and the least - 0 in 2005. The data has a rising trend.
The average number of yearly fire incidents per 10k residents in Newport, KY compared to nearest cities:
(Note: Based on data for the last 3 years, including only cities with population 5,000 and above)
| Newport: | 44.7 |
| Bellevue: | 12.4 |
| Dayton: | 30.1 |
| Covington: | 49.4 |
| Fort Thomas: | 0.6 |
| Fort Wright: | 20.3 |
| Highland Heights: | 13.4 |
| Fort Mitchell: | 26.6 |
| Taylor Mill: | 24.8 |
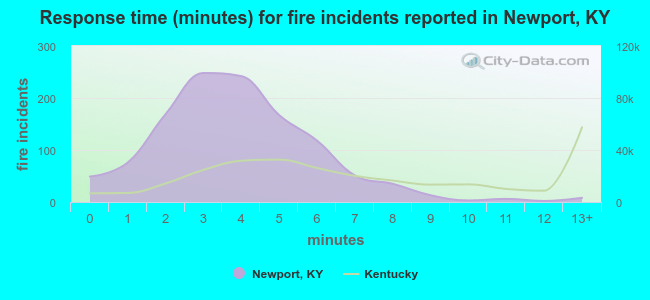 The median response time based on all reported fire incidents is 4 minutes. This is lower compared to the Kentucky median value.
The median response time in Newport, KY compared to nearest cities:
(Note: Based on data for all years, including only cities with at least 500 fire incidents)
| Newport: | 4 minutes |
| Covington: | 4 minutes |
| Fort Wright: | 6 minutes |
| Erlanger: | 5 minutes |
| Independence: | 5 minutes |
| Alexandria: | 7 minutes |
| Florence: | 6 minutes |
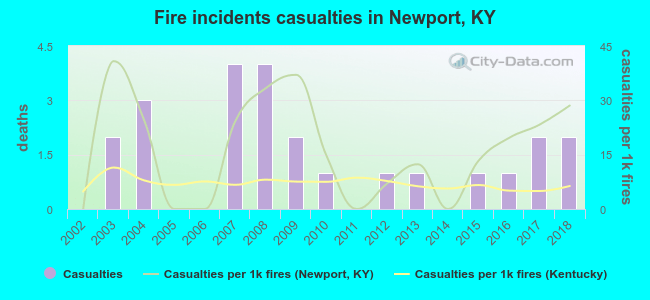 According to the reports from the years 2002 - 2018 the average number of fire-related casualties per year is 1. The highest number of casualties - 4 took place in 2007, and the lowest - 0 in 2002. The data has a growing trend.
The average number of casualties per 1,000 fires is 16. This indicator was the highest - 41 in 2003, and the lowest 0 in 2002. The trend for casualties per 1,000 incidents is rising. Compared to the state value the number of casualties per 1,000 fires is much higher.
According to the reports from the years 2002 - 2018 the average number of fire-related casualties per year is 1. The highest number of casualties - 4 took place in 2007, and the lowest - 0 in 2002. The data has a growing trend.
The average number of casualties per 1,000 fires is 16. This indicator was the highest - 41 in 2003, and the lowest 0 in 2002. The trend for casualties per 1,000 incidents is rising. Compared to the state value the number of casualties per 1,000 fires is much higher.Casualties per 1,000 incidents in Newport, KY compared to nearest cities:
(Note: Based on data for all years, including only cities with at least 500 fire incidents)
| Newport: | 20.2 |
| Covington: | 14.0 |
| Fort Wright: | 3.9 |
| Erlanger: | 5.0 |
| Independence: | 8.4 |
| Alexandria: | 14.1 |
| Florence: | 14.5 |
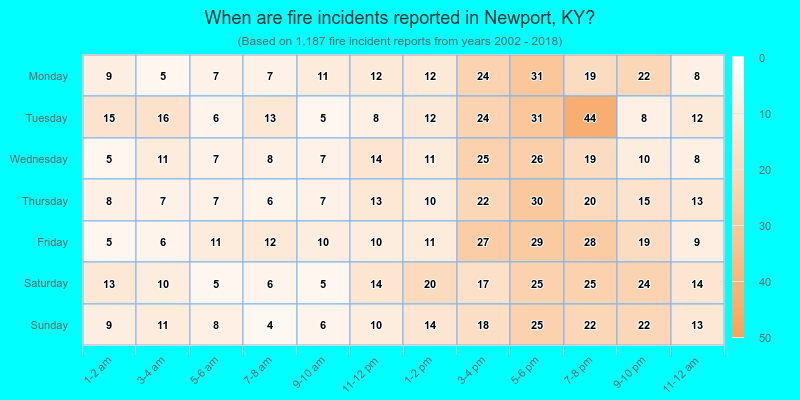
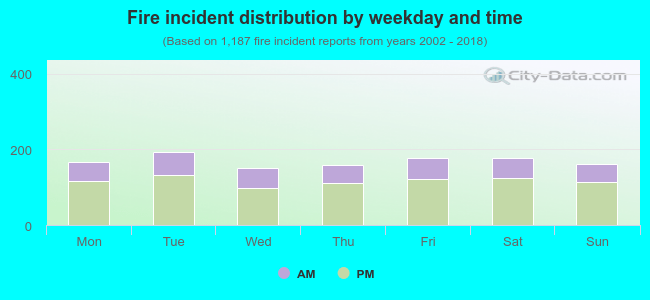 31.1% incidents where reported in the morning and 68.9% in the evening. The most fires (16.3%) took place on Tuesday, and the least (12.7%) on Wednesday.
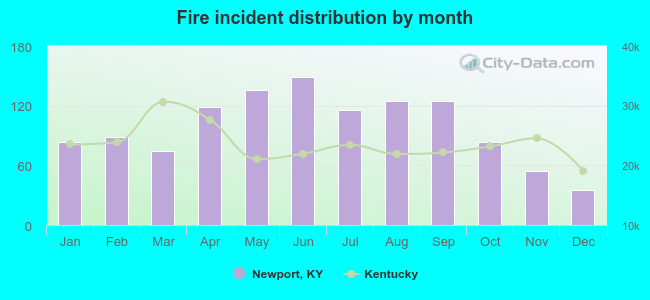 According to the 1,187 fire incident reports from years 2002 - 2018 most fires (12.6%) took place during June, and the least (2.9%) in December.
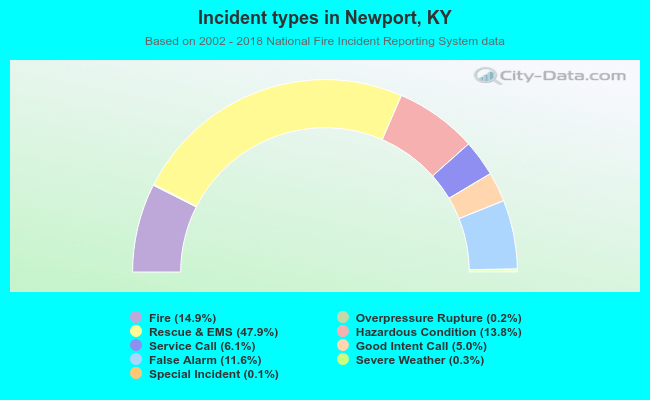 Out of all 7,959 cases reported during the years 2002 - 2018, the most belonged to the categories: Rescue & EMS (47.9%), Fire (14.9%), and Hazardous Condition (13.8%).
 When looking into fire subcategories, the most reports belonged to: Outside Fires (50.2%), and Structure Fires (31.7%).