Covington: Fire Incidents, Kentucky (KY)
Where are fire incidents reported in Covington, KY
Something went wrong! Please refresh the page.
| Fire incidents reported | |
|---|---|
| Sreet name | Count |
| MADISON AVE | 298 |
| SCOTT ST | 166 |
| GREENUP ST | 160 |
| 11TH ST | 124 |
| BANKLICK ST | 94 |
| PIKE ST | 94 |
| HIGHWAY AVE | 76 |
| RUSSELL ST | 70 |
| 16TH ST | 64 |
| 4TH ST | 64 |
| HOLMAN ST | 60 |
| GARRARD ST | 58 |
| DECOURSEY AVE | 54 |
| MAIN ST | 52 |
| 15TH ST | 50 |
| EDGECLIFF RD | 50 |
| PHILADELPHIA ST | 50 |
| 17TH ST | 48 |
| 3RD ST | 46 |
| WINSTON AVE | 46 |
| 12TH ST | 42 |
| 10TH ST | 40 |
| CRESCENT AVE | 40 |
| LOCKE ST | 40 |
| MARTIN ST | 40 |
| RIVERCENTER BLVD | 38 |
| WALLACE AVE | 38 |
| 13TH ST | 36 |
| 8TH ST | 36 |
| 9TH ST | 36 |
| Other | 182 |
2009 - 2018 National Fire Incident Reporting System (NFIRS) incidents
- Incident types reported to NFIRS in Covington, KY
- 8,83944.5%Rescue & EMS
- 2,62913.2%Good Intent Call
- 2,39612.1%False Alarm
- 2,29211.5%Fire
- 2,20011.1%Hazardous Condition
- 1,4167.1%Service Call
- 410.2%Severe Weather
- 340.2%Special Incident
- 250.1%Overpressure Rupture
- Fire incident types reported to NFIRS in Covington, KY
- 1,12649.1%Structure Fires
- 86137.6%Outside Fires
- 29012.7%Mobile Property/Vehicle Fires
- 150.7%Other
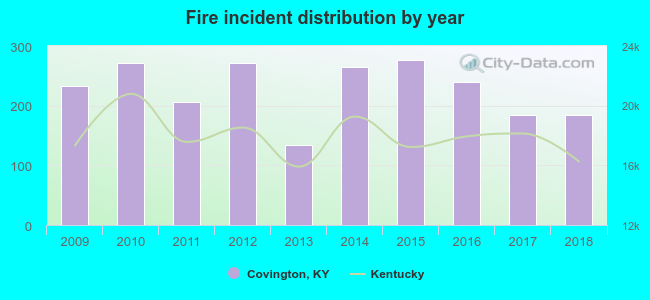 Based on the data from the years 2009 - 2018 the average number of fires per year is 226. The highest number of reported fires - 276 took place in 2015, and the least - 134 in 2013. The data has a declining trend.
The average number of yearly fire incidents per 10k residents in Covington, KY compared to nearest cities:
(Note: Based on data for the last 3 years, including only cities with population 5,000 and above)
| Covington: | 49.4 |
| Fort Wright: | 20.3 |
| Newport: | 44.7 |
| Bellevue: | 12.4 |
| Fort Mitchell: | 26.6 |
| Fort Thomas: | 0.6 |
| Highland Heights: | 13.4 |
| Taylor Mill: | 24.8 |
| Dayton: | 30.1 |
 The median response time based on all reported fire incidents is 4 minutes. This is lower than the Kentucky median value.
The median response time in Covington, KY compared to nearest cities:
(Note: Based on data for all years, including only cities with at least 500 fire incidents)
| Covington: | 4 minutes |
| Fort Wright: | 6 minutes |
| Newport: | 4 minutes |
| Erlanger: | 5 minutes |
| Independence: | 5 minutes |
| Florence: | 6 minutes |
| Alexandria: | 7 minutes |
| Burlington: | 7 minutes |
| Hebron: | 6 minutes |
 According to the data from the years 2009 - 2018 the average number of fire-related fatalities per year is 1. The highest number of reported deaths - 2 took place in 2010, and the lowest - 0 in 2011. The data has a decreasing trend.
 Based on the reports from the years 2009 - 2018 the average number of fire-related casualties per year is 3. The highest number of injuries - 7 took place in 2010, and the lowest - 0 in 2011. The data has a declining trend.
The average number of casualties per 1,000 fire incidents is 13. This indicator was the highest - 26 in 2010, and the lowest 0 in 2011. The trend for casualties per 1,000 fires is decreasing. Compared to the state value the number of injuries per 1,000 fire incidents is higher.
Based on the reports from the years 2009 - 2018 the average number of fire-related casualties per year is 3. The highest number of injuries - 7 took place in 2010, and the lowest - 0 in 2011. The data has a declining trend.
The average number of casualties per 1,000 fire incidents is 13. This indicator was the highest - 26 in 2010, and the lowest 0 in 2011. The trend for casualties per 1,000 fires is decreasing. Compared to the state value the number of injuries per 1,000 fire incidents is higher.Casualties per 1,000 incidents in Covington, KY compared to nearest cities:
(Note: Based on data for all years, including only cities with at least 500 fire incidents)
| Covington: | 14.0 |
| Fort Wright: | 3.9 |
| Newport: | 20.2 |
| Erlanger: | 5.0 |
| Independence: | 8.4 |
| Florence: | 14.5 |
| Alexandria: | 14.1 |
| Burlington: | 14.4 |
| Hebron: | 3.9 |
 27.5% incidents where reported in the morning and 72.5% in the evening. The most fires (14.7%) took place on Saturday, and the least (13.5%) on Sunday.
 According to the 2,292 fire incidents from years 2009 - 2018 most fires (10.5%) took place during July, and the least (5.5%) in February.
 Out of all 19,872 cases reported during the years 2009 - 2018, the most belonged to the categories: Rescue & EMS (44.5%), Good Intent Call (13.2%), and False Alarm (12.1%).
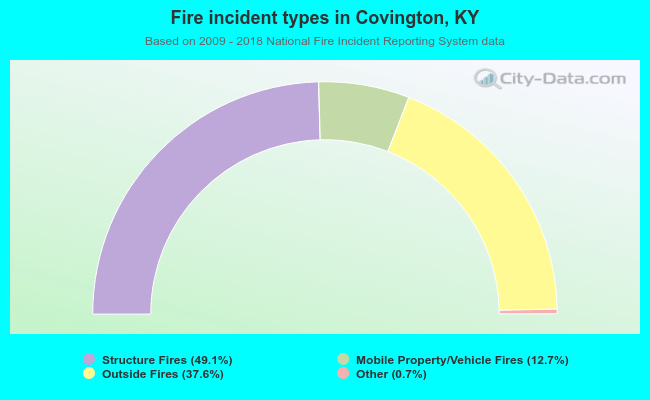 When looking into fire subcategories, the most reports belonged to: Structure Fires (49.1%), and Outside Fires (37.6%).