Mount Kisco: Fire Incidents, New York (NY)
Where are fire incidents reported in Mount Kisco, NY
Something went wrong! Please refresh the page.
|
| |||||||||||||||||||||||||||||||||||||||||||||||||||||||||||||||||||||||||||||||||||||||||||||||||||||||||||||
2005 - 2018 National Fire Incident Reporting System (NFIRS) incidents
- Incident types reported to NFIRS in Mount Kisco, NY
- 74833.6%False Alarm
- 71532.1%Hazardous Condition
- 26712.0%Fire
- 1988.9%Good Intent Call
- 1456.5%Rescue & EMS
- 1446.5%Service Call
- 60.3%Overpressure Rupture
- Fire incident types reported to NFIRS in Mount Kisco, NY
- 18368.5%Structure Fires
- 5721.3%Outside Fires
- 197.1%Mobile Property/Vehicle Fires
- 83.0%Other
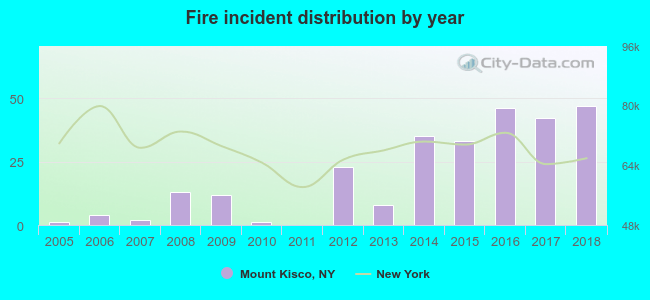 Based on the data from the years 2005 - 2018 the average number of fire incidents per year is 19. The highest number of reported fires - 47 took place in 2018, and the least - 0 in 2011. The data has a rising trend.
The average number of yearly fire incidents per 10k residents in Mount Kisco, NY compared to nearest cities:
(Note: Based on data for the last 3 years, including only cities with population 5,000 and above)
| Mount Kisco: | 40.5 |
| New Castle: | 1.1 |
| Pleasantville: | 6.3 |
| North Castle: | 5.9 |
| Yorktown: | 11.7 |
| Ossining: | 12.8 |
| Briarcliff Manor: | 10.4 |
| Pound Ridge: | 33.3 |
| Somers: | 9.8 |
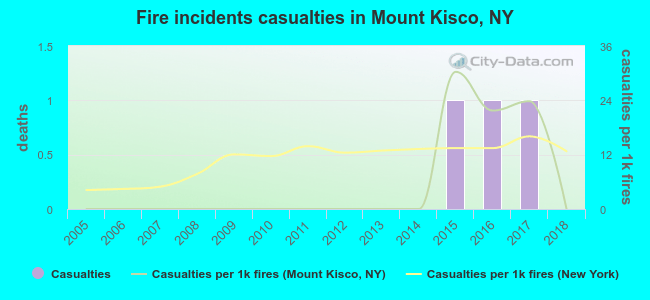 Based on the data from the years 2005 - 2018 the average number of fire-related casualties per year is 0. The highest number of reported injuries - 1 took place in 2015, and the lowest - 0 in 2005. The data has a constant trend.
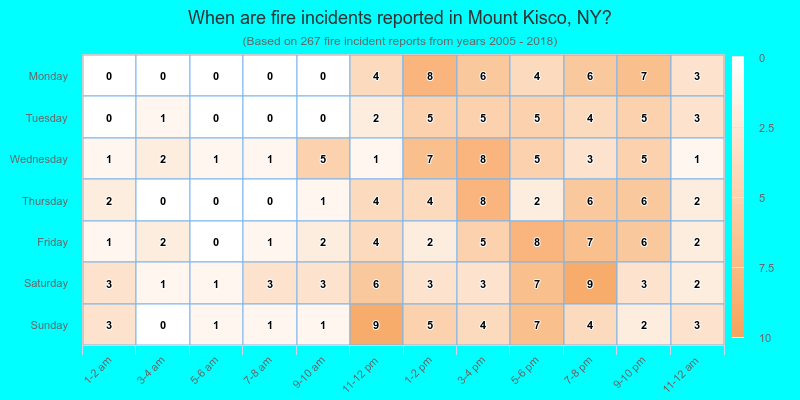
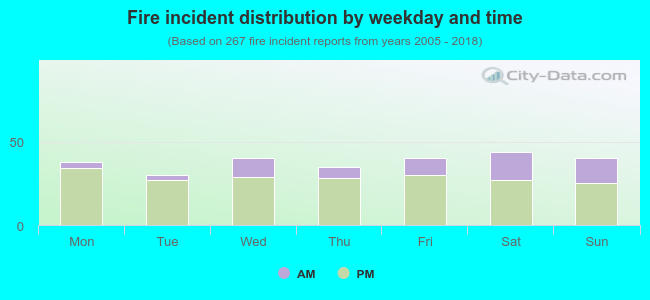 25.1% incidents where reported in the morning and 74.9% in the evening. The most fires (16.5%) took place on Saturday, and the least (11.2%) on Tuesday.
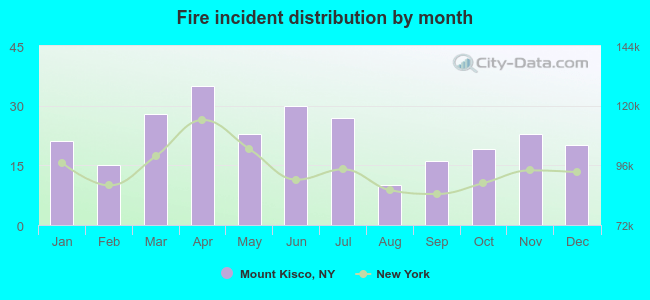 Based on the 267 fires from years 2005 - 2018 most fires (13.1%) took place during April, and the least (3.7%) in August.
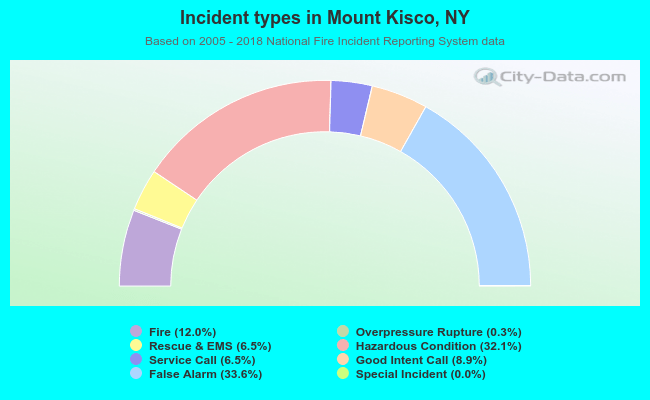 Out of all 2,224 cases reported during the years 2005 - 2018, the most belonged to the categories: False Alarm (33.6%), Hazardous Condition (32.1%), and Fire (12.0%).
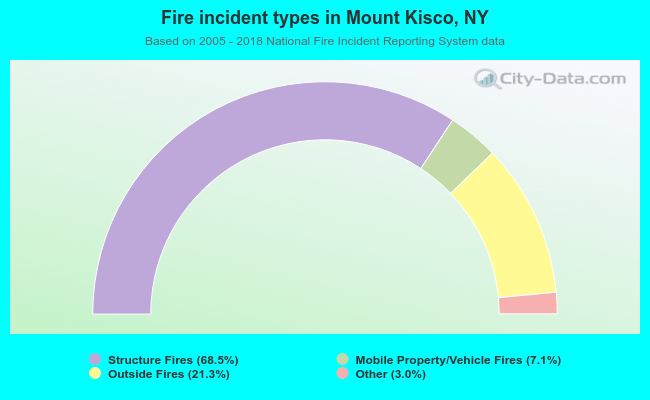 When looking into fire subcategories, the most incidents belonged to: Structure Fires (68.5%), and Outside Fires (21.3%).