| Fire incidents reported |
|---|
| Sreet name | Count |
|---|
| HENRY RD | 8 | | MORRILL RD | 4 | | PURVIANCE RD | 4 | | 100777 CR D | 2 | | 100965 CR D | 2 | | 102 WEST WEBSTER STREET | 2 | | 151 HENRY ROAD | 2 | | 210 JIRDON AVE | 2 | | 220 SI RD | 2 | | 260 SG RD | 2 | | 30057 CR 7 | 2 | | 30122 WILLOW DRIVE | 2 | | 30190 SHEILDS LANE LN | 2 | | 30507 SOUTH MORRILL RD | 2 | | 30777 CR A | 2 | | 381 SC RD | 2 | | 390 SA RD | 2 | | 40800 SOUTH MORRILL RD | 2 | | 414 ADAMS AVE | 2 | | 450 SC RD | 2 | | 453 S7 RD | 2 | | 50681 CR D | 2 | | 517 W WEBSTER | 2 | | 580 SC RD | 2 | | 610 COUNTY ROAD | 2 |
| | | Fire incidents reported |
|---|
| Sreet name | Count |
|---|
| 632 SB RD | 2 | | 640 SC RD | 2 | | 653 SC ROAD | 2 | | 656 SC RD RDS | 2 | | 656 SC ROAD | 2 | | 657 S7 RD RDS | 2 | | 70501 HWY 26 | 2 | | 70818 CO RD G | 2 | | 80491 CR B | 2 | | 80510 PURVIANCE RD | 2 | | 80681 EAST CHARLES STREET | 2 | | BNSF RAIL ROAD TRACKS | 2 | | CHARLES | 2 | | COUNTY RD | 2 | | CR 3 CR A | 2 | | CR 7CR A | 2 | | CR 8CR B XRDS | 2 | | CR A CR 8 | 2 | | CR B CR7 | 2 | | CR H CR 9 | 2 | | CR7HWY 26 | 2 | | DILLMAN DR | 2 | | FRANKLIN ST | 2 | | HENRY ROAD | 2 | | |
|
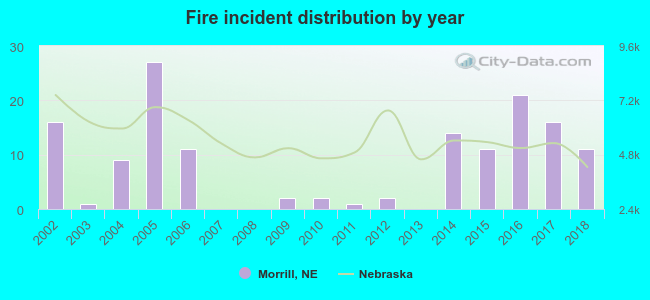 According to the data from the years 2002 - 2018 the average number of fires per year is 8. The highest number of fire incidents - 27 took place in 2005, and the least - 0 in 2007. The data has a decreasing trend.
 14.6% incidents where reported in the morning and 85.4% in the evening. The most fires (16.7%) took place on Wednesday, and the least (11.1%) on Monday.
 Based on the 144 fire incidents from years 2002 - 2018 most fires (25.0%) took place during July, and the least (2.1%) in September.
 Out of all 194 cases reported during the years 2002 - 2018, the most belonged to the categories: Fire (74.2%), Overpressure Rupture (9.8%), and Service Call (9.8%).
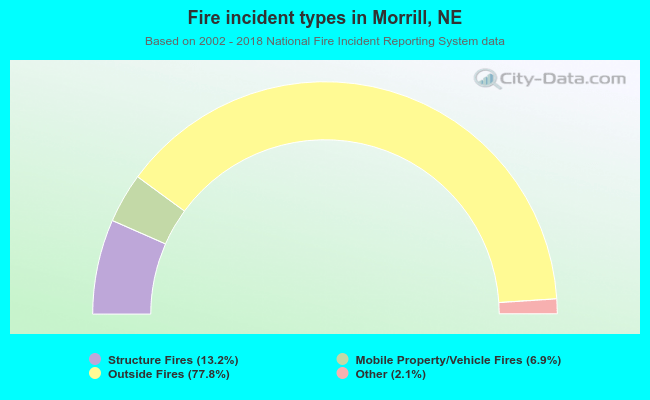 When looking into fire subcategories, the most reports belonged to: Outside Fires (77.8%), and Structure Fires (13.2%).