Montgomeryville: Fire Incidents, Pennsylvania (PA)
Where are fire incidents reported in Montgomeryville, PA
Something went wrong! Please refresh the page.
|
| |||||||||||||||||||||||||||||||||||||||||||||||||||||||||||||||||||||||||||||||||||||||||||||||||||||||||||||
2003 - 2018 National Fire Incident Reporting System (NFIRS) incidents
- Incident types reported to NFIRS in Montgomeryville, PA
- 28684.6%Fire
- 185.3%Good Intent Call
- 154.4%Service Call
- 113.3%Hazardous Condition
- 51.5%Rescue & EMS
- 30.9%False Alarm
- Fire incident types reported to NFIRS in Montgomeryville, PA
- 21073.4%Structure Fires
- 7124.8%Other
- 51.7%Outside Fires
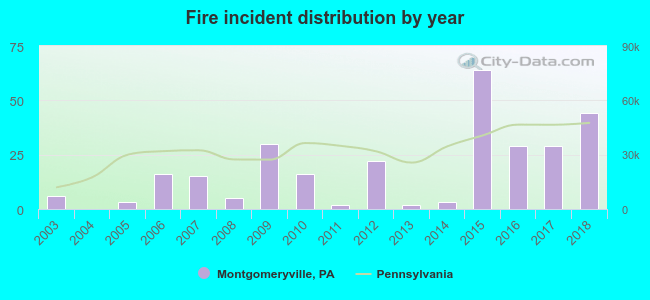 According to the data from the years 2003 - 2018 the average number of fire incidents per year is 18. The highest number of fires - 64 took place in 2015, and the least - 0 in 2004. The data has a growing trend.
The average number of yearly fire incidents per 10k residents in Montgomeryville, PA compared to nearest cities:
(Note: Based on data for the last 3 years, including only cities with population 5,000 and above)
| Montgomeryville: | 26.9 |
| Lansdale: | 10.5 |
| Maple Glen: | 3.0 |
| Souderton: | 31.2 |
| Ambler: | 37.4 |
| Doylestown: | 143.7 |
| Horsham: | 23.8 |
| Blue Bell: | 16.5 |
| Fort Washington: | 36.1 |

 31.1% incidents where reported in the morning and 68.9% in the evening. The most fires (17.5%) took place on Saturday, and the least (11.2%) on Sunday.
 Based on the 286 fire incident reports from years 2003 - 2018 most fires (11.9%) took place during January, and the least (4.2%) in September.
 Out of all 338 cases reported during the years 2003 - 2018, the most belonged to the categories: Fire (84.6%), Service Call (5.3%), and Hazardous Condition (4.4%).
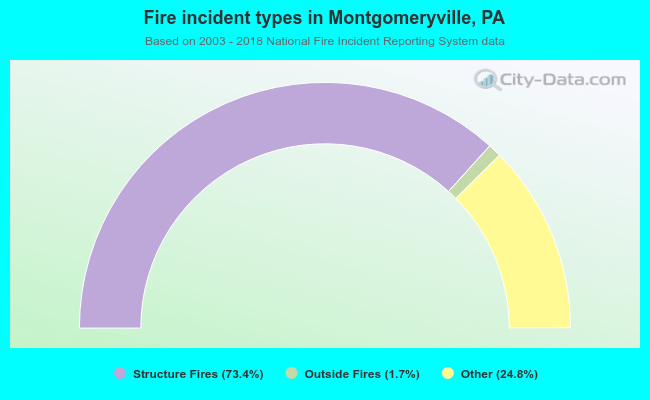 When looking into fire subcategories, the most incidents belonged to: Structure Fires (73.4%), and Outside Fires (24.8%).