McCook: Fire Incidents, Nebraska (NE)
Where are fire incidents reported in McCook, NE
Something went wrong! Please refresh the page.
|
| |||||||||||||||||||||||||||||||||||||||||||||||||||||||||||||||||||||||||||||||||||||||||||||||||||||||||||||
2002 - 2018 National Fire Incident Reporting System (NFIRS) incidents
- Incident types reported to NFIRS in McCook, NE
- 3,65875.4%Rescue & EMS
- 4659.6%Hazardous Condition
- 4038.3%Fire
- 1563.2%False Alarm
- 1092.2%Service Call
- 581.2%Good Intent Call
- Fire incident types reported to NFIRS in McCook, NE
- 16741.4%Outside Fires
- 14636.2%Structure Fires
- 7117.6%Mobile Property/Vehicle Fires
- 194.7%Other
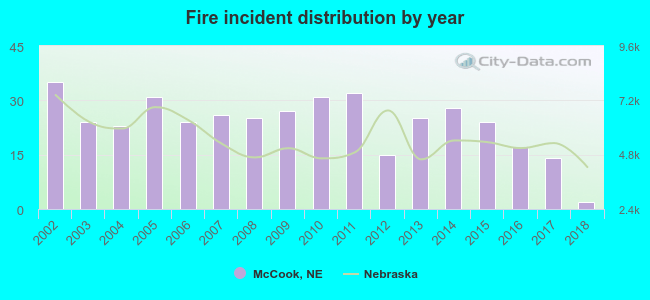 According to the data from the years 2002 - 2018 the average number of fires per year is 24. The highest number of fires - 35 took place in 2002, and the least - 2 in 2018. The data has a decreasing trend.
The average number of yearly fire incidents per 10k residents in McCook, NE compared to nearest cities:
(Note: Based on data for the last 3 years, including only cities with population 5,000 and above)
| McCook: | 14.5 |
| Lexington: | 11.5 |
| North Platte: | 35.4 |
| Holdrege: | 37.5 |
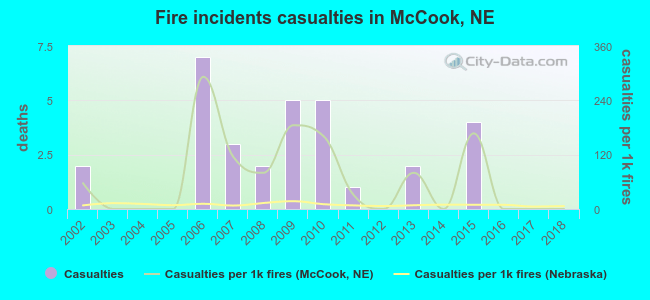 Based on the data from the years 2002 - 2018 the average number of fire-related yearly casualties is 2. The highest number of casualties - 7 took place in 2006, and the lowest - 0 in 2003. The data has a decreasing trend.
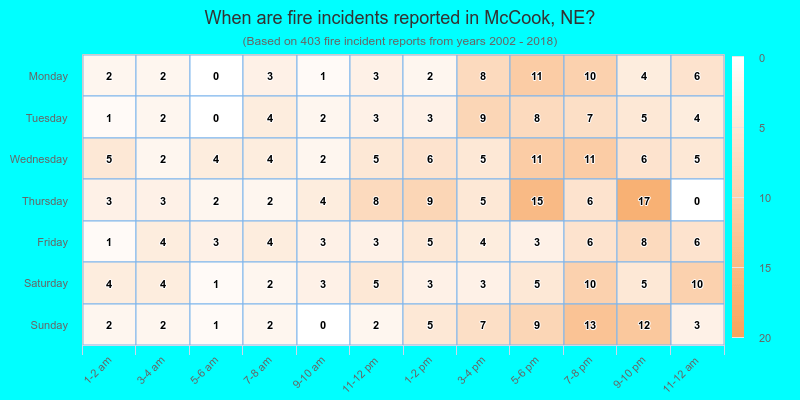
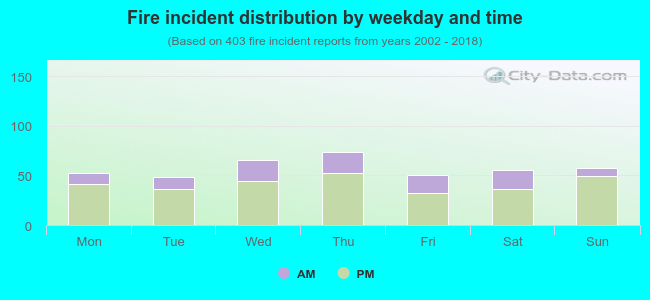 28.0% incidents where reported in the morning and 72.0% in the evening. The most fires (18.4%) took place on Thursday, and the least (11.9%) on Tuesday.
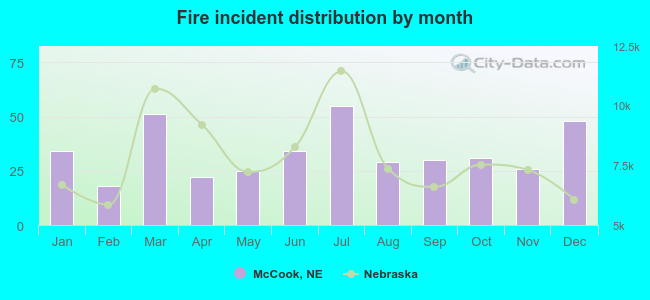 According to the 403 fire incident reports from years 2002 - 2018 most fires (13.6%) took place during July, and the least (4.5%) in February.
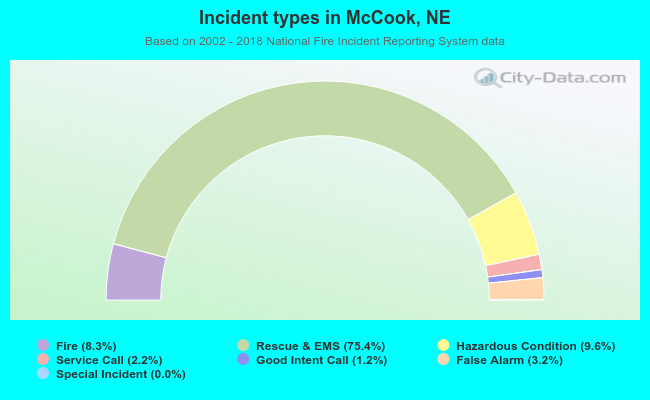 Out of all 4,850 cases reported during the years 2002 - 2018, the most belonged to the categories: Overpressure Rupture (75.4%), Rescue & EMS (9.6%), and Fire (8.3%).
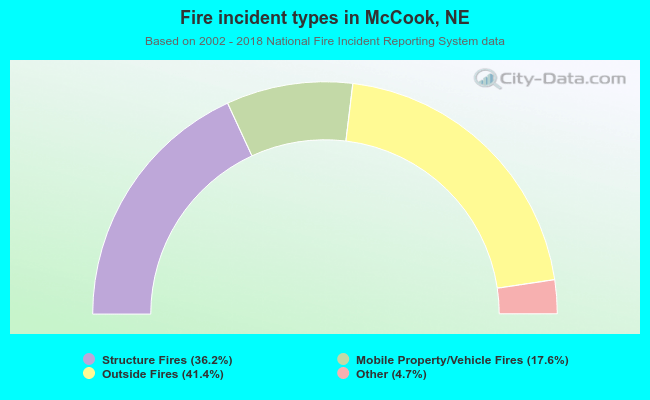 When looking into fire subcategories, the most reports belonged to: Outside Fires (41.4%), and Structure Fires (36.2%).