Lexington: Fire Incidents, Nebraska (NE)
Where are fire incidents reported in Lexington, NE
Something went wrong! Please refresh the page.
|
| |||||||||||||||||||||||||||||||||||||||||||||||||||||||||||||||||||||||||||||||||||||||||||||||||||||||||||||
2002 - 2018 National Fire Incident Reporting System (NFIRS) incidents
- Incident types reported to NFIRS in Lexington, NE
- 1,49962.3%Rescue & EMS
- 41917.4%Fire
- 2008.3%Service Call
- 1456.0%Good Intent Call
- 793.3%Special Incident
- 351.5%Hazardous Condition
- 220.9%False Alarm
- 40.2%Severe Weather
- Fire incident types reported to NFIRS in Lexington, NE
- 24257.8%Structure Fires
- 10424.8%Outside Fires
- 6816.2%Mobile Property/Vehicle Fires
- 51.2%Other
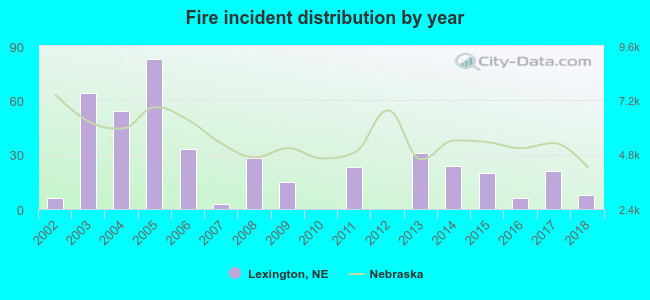 Based on the data from the years 2002 - 2018 the average number of fires per year is 25. The highest number of fire incidents - 83 took place in 2005, and the least - 0 in 2010. The data has a growing trend.
The average number of yearly fire incidents per 10k residents in Lexington, NE compared to nearest cities:
(Note: Based on data for the last 3 years, including only cities with population 5,000 and above)
| Lexington: | 11.5 |
| Holdrege: | 37.5 |
| Kearney: | 1.2 |
| North Platte: | 35.4 |
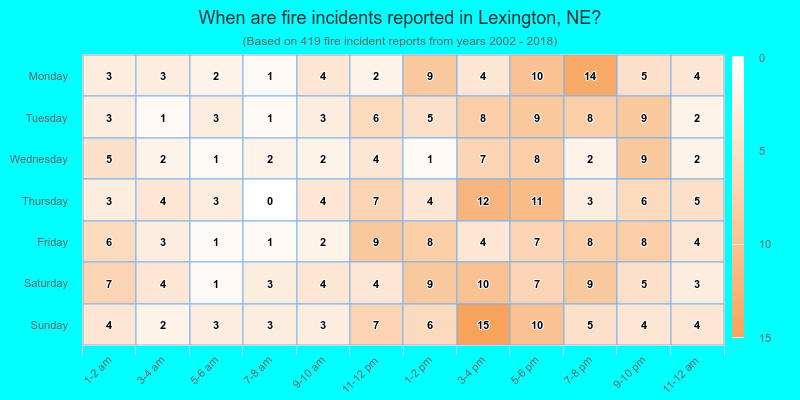
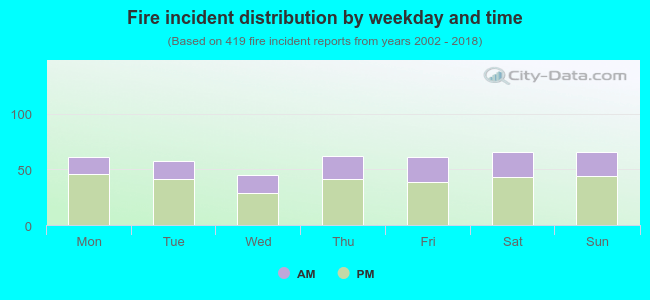 32.5% incidents where reported in the morning and 67.5% in the evening. The most fires (15.8%) took place on Saturday, and the least (10.7%) on Wednesday.
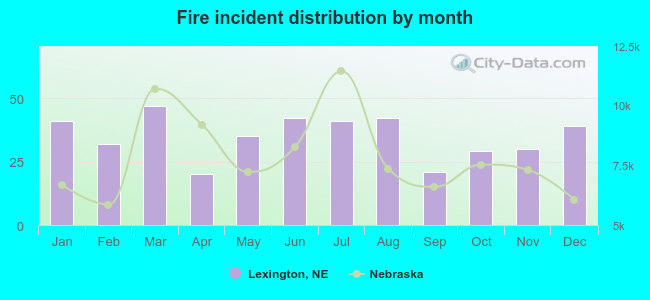 Based on the 419 reports from years 2002 - 2018 most fires (11.2%) took place during March, and the least (4.8%) in April.
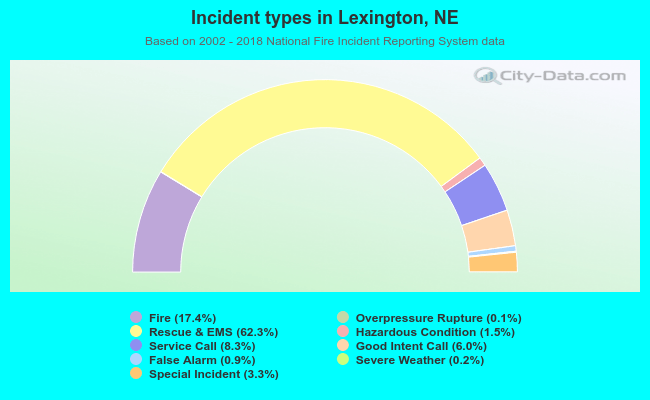 Out of all 2,405 cases reported during the years 2002 - 2018, the most belonged to the categories: Rescue & EMS (62.3%), Fire (17.4%), and Service Call (8.3%).
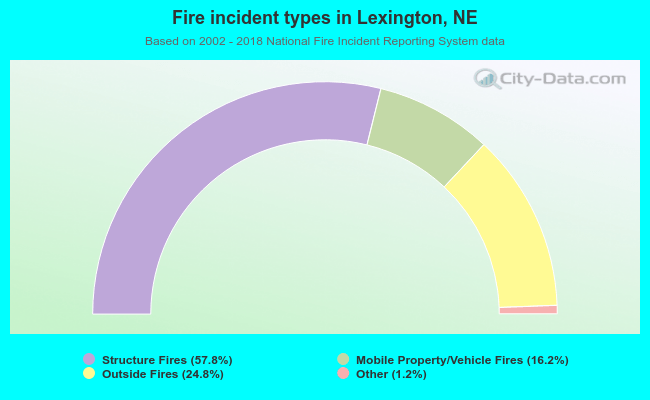 When looking into fire subcategories, the most reports belonged to: Structure Fires (57.8%), and Outside Fires (24.8%).