Mascoutah: Fire Incidents, Illinois (IL)
Where are fire incidents reported in Mascoutah, IL
Something went wrong! Please refresh the page.
|
| |||||||||||||||||||||||||||||||||||||||||||||||||||||||||||||||||||||||||||||||||||||||||||||||||||||||||||||
2002 - 2018 National Fire Incident Reporting System (NFIRS) incidents
- Incident types reported to NFIRS in Mascoutah, IL
- 1,20051.0%Hazardous Condition
- 43718.6%Fire
- 24310.3%Good Intent Call
- 2239.5%False Alarm
- 1988.4%Rescue & EMS
- 472.0%Service Call
- 70.3%Severe Weather
- Fire incident types reported to NFIRS in Mascoutah, IL
- 18442.1%Structure Fires
- 16036.6%Outside Fires
- 6715.3%Mobile Property/Vehicle Fires
- 265.9%Other
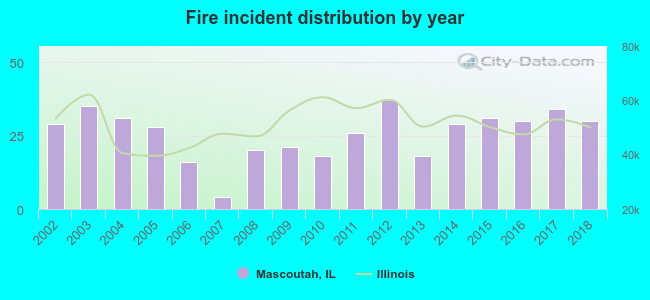 Based on the data from the years 2002 - 2018 the average number of fire incidents per year is 26. The highest number of reported fire incidents - 37 took place in 2012, and the least - 4 in 2007. The data has a rising trend.
The average number of yearly fire incidents per 10k residents in Mascoutah, IL compared to nearest cities:
(Note: Based on data for the last 3 years, including only cities with population 5,000 and above)
| Mascoutah: | 39.8 |
| Shiloh: | 5.4 |
| Swansea: | 29.8 |
| Belleville: | 74.5 |
| Fairview Heights: | 48.7 |
| Collinsville: | 53.9 |
| Troy: | 44.4 |
| Centreville: | 233.1 |
| Maryville: | 3.8 |

 32.3% incidents where reported in the morning and 67.7% in the evening. The most fires (18.5%) took place on Saturday, and the least (8.9%) on Thursday.
 Based on the 437 fire incidents from years 2002 - 2018 most fires (10.8%) took place during March, and the least (5.7%) in December.
 Out of all 2,355 cases reported during the years 2002 - 2018, the most belonged to the categories: Rescue & EMS (51.0%), Fire (18.6%), and Service Call (10.3%).
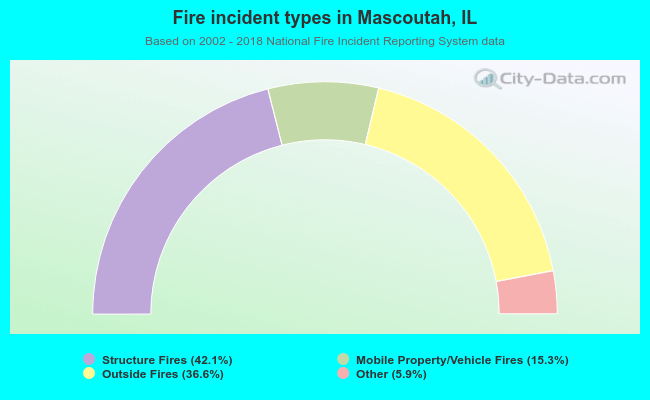 When looking into fire subcategories, the most incidents belonged to: Structure Fires (42.1%), and Outside Fires (36.6%).