Louisville: Fire Incidents, Kentucky (KY)
Where are fire incidents reported in Louisville, KY
Something went wrong! Please refresh the page.
| Fire incidents reported | |
|---|---|
| Sreet name | Count |
| DIXIE HWY | 1,066 |
| 4TH ST | 908 |
| BARDSTOWN RD | 752 |
| PRESTON HWY | 752 |
| MUHAMMAD ALI BLVD | 746 |
| 3RD ST | 610 |
| BROADWAY | 540 |
| I 264 | 524 |
| MARKET ST | 492 |
| TAYLOR BLVD | 462 |
| SHELBYVILLE RD | 414 |
| CANE RUN RD | 388 |
| KENTUCKY ST | 386 |
| 2ND ST | 374 |
| OUTER LOOP RD | 374 |
| JEFFERSON ST | 368 |
| 5TH ST | 364 |
| POPLAR LEVEL RD | 364 |
| OAK ST | 362 |
| 8TH ST | 354 |
| BUECHEL BANK RD | 344 |
| 26TH ST | 298 |
| BANK ST | 298 |
| MAIN ST | 298 |
| HALE AVE | 290 |
| 28TH ST | 278 |
| ORMSBY AVE | 274 |
| CHESTNUT ST | 272 |
| 6TH ST | 270 |
| PRESTON ST | 266 |
| Other | 23,625 |
2002 - 2018 National Fire Incident Reporting System (NFIRS) incidents
- Incident types reported to NFIRS in Louisville, KY
- 100,67436.8%Rescue & EMS
- 54,38819.9%Hazardous Condition
- 39,66714.5%Good Intent Call
- 37,11313.6%Fire
- 29,22210.7%False Alarm
- 10,9654.0%Service Call
- 5840.2%Overpressure Rupture
- 5180.2%Special Incident
- Fire incident types reported to NFIRS in Louisville, KY
- 15,35841.4%Structure Fires
- 13,88537.4%Outside Fires
- 6,73918.2%Mobile Property/Vehicle Fires
- 1,1313.0%Other
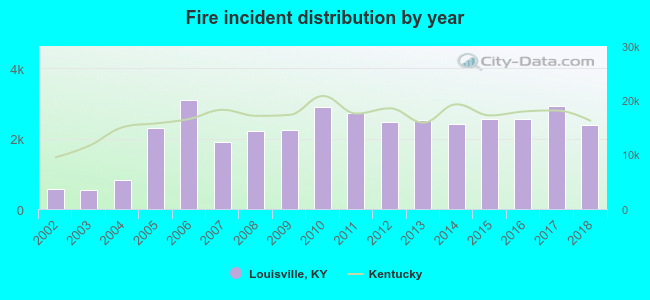 Based on the data from the years 2002 - 2018 the average number of fire incidents per year is 2,183. The highest number of reported fires - 3,083 took place in 2006, and the least - 539 in 2003. The data has a growing trend.
The average number of yearly fire incidents per 10k residents in Louisville, KY compared to nearest cities:
(Note: Based on data for the last 3 years, including only cities with population 5,000 and above)
| Louisville: | 99.8 |
| Shively: | 11.2 |
| Okolona: | 0.5 |
| Fairdale: | 29.7 |
| Lyndon: | 0.9 |
| Fern Creek: | 25.6 |
| Jeffersontown: | 23.4 |
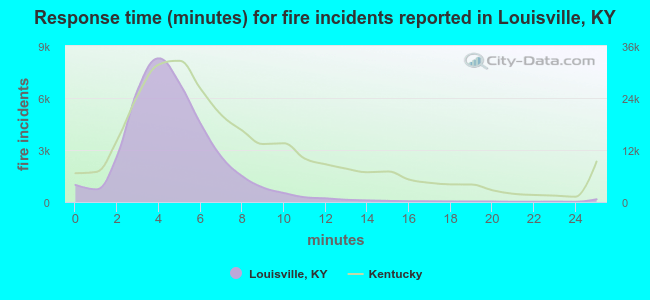 The median response time based on all reported fire incidents is 4 minutes. This is lower compared to the Kentucky median value.
The median response time in Louisville, KY compared to nearest cities:
(Note: Based on data for all years, including only cities with at least 500 fire incidents)
| Louisville: | 4 minutes |
| Jeffersonville: | 4 minutes |
| Clarksville: | 4 minutes |
| New Albany: | 4 minutes |
| Fairdale: | 5 minutes |
| Fern Creek: | 5 minutes |
| Jeffersontown: | 5 minutes |
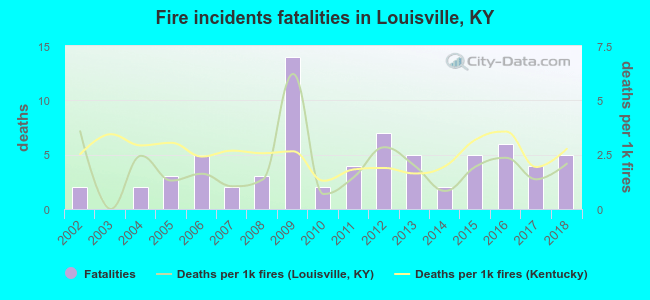 Based on the data from the years 2002 - 2018 the average number of fire-related yearly deaths is 4. The highest number of deaths - 14 took place in 2009, and the lowest - 0 in 2003. The data has a rising trend.
The average number of fatalities per 1,000 fire incidents is 2. This indicator was the highest - 6 in 2009, and the lowest 0 in 2003. The trend for fatalities per 1,000 fires is declining. Compared to the Kentucky value the number of deaths per 1,000 fires is lower.
Based on the data from the years 2002 - 2018 the average number of fire-related yearly deaths is 4. The highest number of deaths - 14 took place in 2009, and the lowest - 0 in 2003. The data has a rising trend.
The average number of fatalities per 1,000 fire incidents is 2. This indicator was the highest - 6 in 2009, and the lowest 0 in 2003. The trend for fatalities per 1,000 fires is declining. Compared to the Kentucky value the number of deaths per 1,000 fires is lower.Deaths per 1,000 incidents in Louisville, KY compared to nearest cities:
(Note: Based on data for all years, including only cities with at least 2,500 fire incidents)
| Louisville: | 1.9 |
| New Albany: | 2.4 |
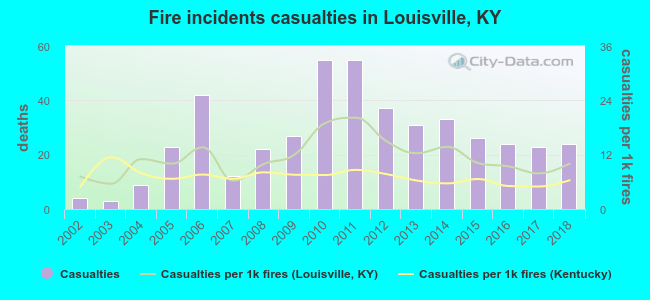 According to the reports from the years 2002 - 2018 the average number of fire-related casualties per year is 26. The highest number of reported casualties - 55 took place in 2010, and the lowest - 3 in 2003. The data has an increasing trend.
The average number of injuries per 1,000 fire incidents is 11. This indicator was the highest - 20 in 2011, and the lowest 6 in 2003. The trend for injuries per 1,000 fire incidents is increasing. Compared to the state value the number of casualties per 1,000 fire incidents is higher.
According to the reports from the years 2002 - 2018 the average number of fire-related casualties per year is 26. The highest number of reported casualties - 55 took place in 2010, and the lowest - 3 in 2003. The data has an increasing trend.
The average number of injuries per 1,000 fire incidents is 11. This indicator was the highest - 20 in 2011, and the lowest 6 in 2003. The trend for injuries per 1,000 fire incidents is increasing. Compared to the state value the number of casualties per 1,000 fire incidents is higher.Casualties per 1,000 incidents in Louisville, KY compared to nearest cities:
(Note: Based on data for all years, including only cities with at least 500 fire incidents)
| Louisville: | 12.1 |
| Jeffersonville: | 16.6 |
| Clarksville: | 5.2 |
| New Albany: | 31.1 |
| Fairdale: | 2.4 |
| Fern Creek: | 1.7 |
| Jeffersontown: | 9.3 |
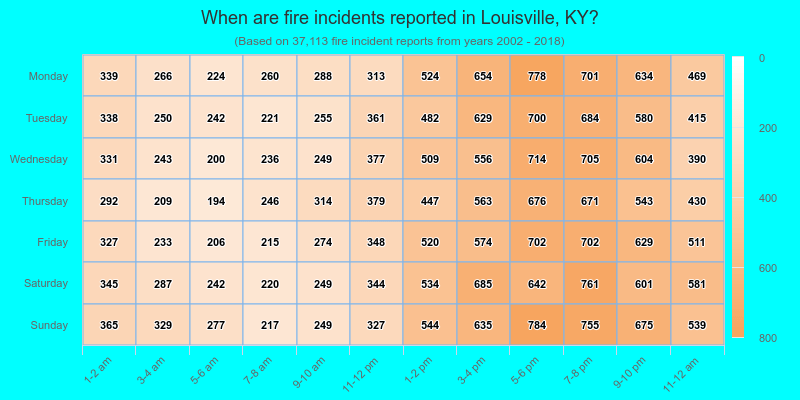
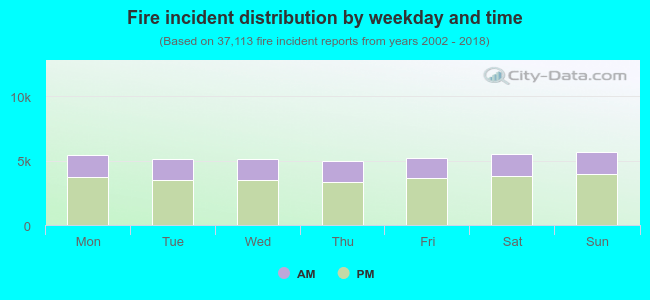 31.5% incidents where reported in the morning and 68.5% in the evening. The most fires (15.3%) took place on Sunday, and the least (13.4%) on Thursday.
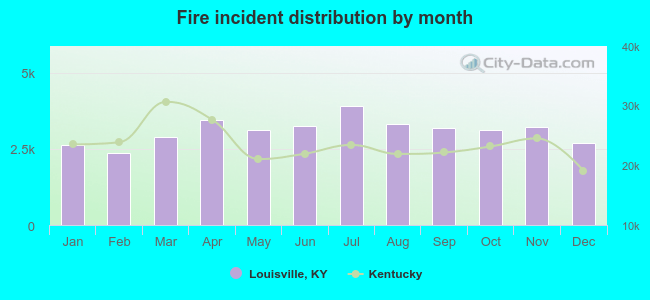 Based on the 37,113 fire incident reports from years 2002 - 2018 most fires (10.6%) took place during July, and the least (6.4%) in February.
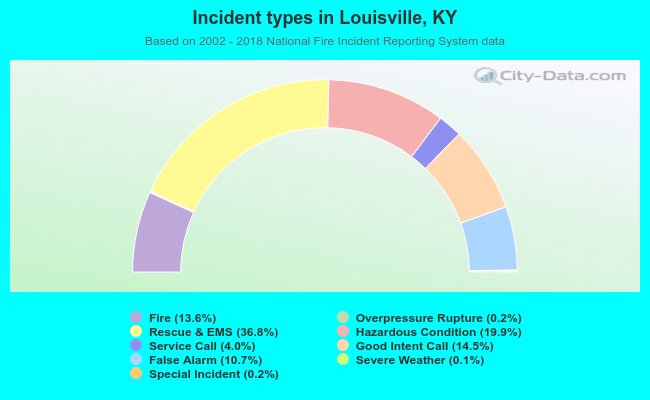 Out of all 273,368 cases reported during the years 2002 - 2018, the most belonged to the categories: Rescue & EMS (36.8%), Hazardous Condition (19.9%), and Good Intent Call (14.5%).
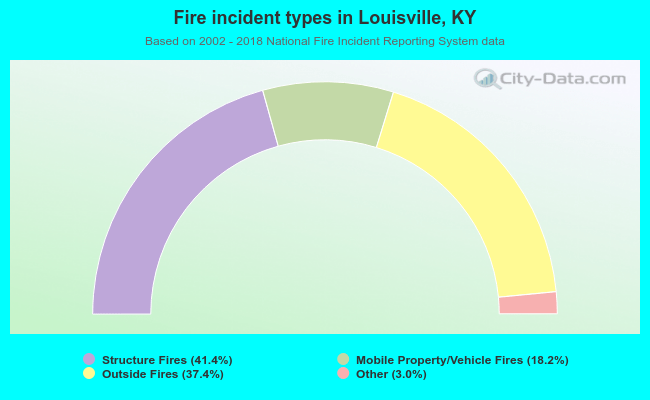 When looking into fire subcategories, the most incidents belonged to: Structure Fires (41.4%), and Outside Fires (37.4%).