Fern Creek: Fire Incidents, Kentucky (KY)
Where are fire incidents reported in Fern Creek, KY
Something went wrong! Please refresh the page.
|
| |||||||||||||||||||||||||||||||||||||||||||||||||||||||||||||||||||||||||||||||||||||||||||||||||||||||||||||
2002 - 2018 National Fire Incident Reporting System (NFIRS) incidents
- Incident types reported to NFIRS in Fern Creek, KY
- 1,39135.7%Hazardous Condition
- 75719.4%Rescue & EMS
- 60615.6%Fire
- 45011.6%False Alarm
- 41610.7%Good Intent Call
- 2235.7%Service Call
- 230.6%Severe Weather
- 160.4%Special Incident
- 120.3%Overpressure Rupture
- Fire incident types reported to NFIRS in Fern Creek, KY
- 23839.3%Outside Fires
- 22537.1%Structure Fires
- 12220.1%Mobile Property/Vehicle Fires
- 213.5%Other
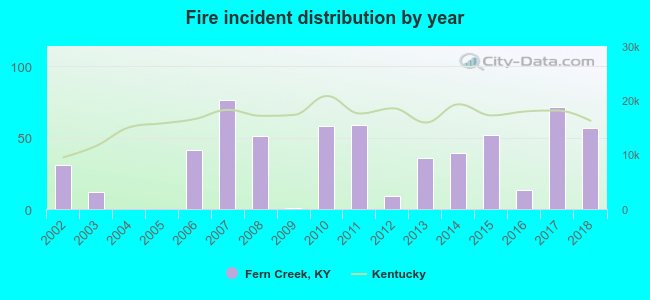 According to the data from the years 2002 - 2018 the average number of fire incidents per year is 36. The highest number of fire incidents - 76 took place in 2007, and the least - 0 in 2004. The data has a rising trend.
The average number of yearly fire incidents per 10k residents in Fern Creek, KY compared to nearest cities:
(Note: Based on data for the last 3 years, including only cities with population 5,000 and above)
| Fern Creek: | 25.6 |
| Jeffersontown: | 23.4 |
| Okolona: | 0.5 |
| Lyndon: | 0.9 |
| Hillview: | 7.5 |
 The median response time based on all reported fire incidents is 5 minutes. This is lower compared to the state median value.
The median response time in Fern Creek, KY compared to nearest cities:
(Note: Based on data for all years, including only cities with at least 500 fire incidents)
| Fern Creek: | 5 minutes |
| Jeffersontown: | 5 minutes |
 26.1% incidents where reported in the morning and 73.9% in the evening. The most fires (17.8%) took place on Friday, and the least (11.7%) on Tuesday.
 According to the 606 incident reports from years 2002 - 2018 most fires (10.2%) took place during March, and the least (6.4%) in July.
 Out of all 3,894 cases reported during the years 2002 - 2018, the most belonged to the categories: Hazardous Condition (35.7%), Rescue & EMS (19.4%), and Fire (15.6%).
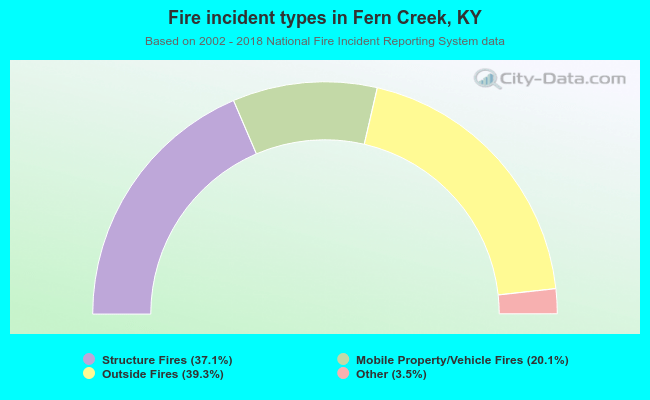 When looking into fire subcategories, the most reports belonged to: Outside Fires (39.3%), and Structure Fires (37.1%).