Little Falls: Fire Incidents, Minnesota (MN)
Where are fire incidents reported in Little Falls, MN
Something went wrong! Please refresh the page.
|
| |||||||||||||||||||||||||||||||||||||||||||||||||||||||||||||||||||||||||||||||||||||||||||||||||||||||||||||
| Other | 106 | |||||||||||||||||||||||||||||||||||||||||||||||||||||||||||||||||||||||||||||||||||||||||||||||||||||||||||||
2006 - 2018 National Fire Incident Reporting System (NFIRS) incidents
- Incident types reported to NFIRS in Little Falls, MN
- 63443.9%Fire
- 31922.1%Hazardous Condition
- 20714.3%Good Intent Call
- 15410.7%Rescue & EMS
- 1047.2%False Alarm
- 161.1%Service Call
- 40.3%Severe Weather
- 30.2%Overpressure Rupture
- 20.1%Special Incident
- Fire incident types reported to NFIRS in Little Falls, MN
- 28745.3%Outside Fires
- 20632.5%Structure Fires
- 10917.2%Mobile Property/Vehicle Fires
- 325.0%Other
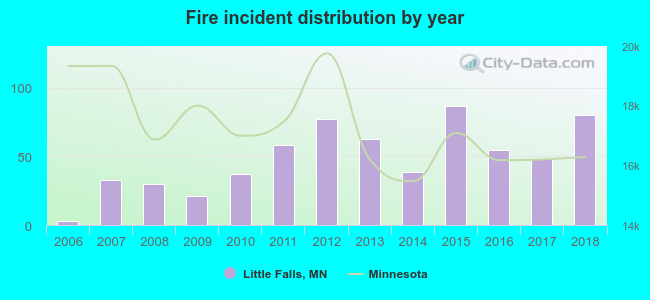 According to the data from the years 2006 - 2018 the average number of fires per year is 49. The highest number of reported fires - 87 took place in 2015, and the least - 3 in 2006. The data has a growing trend.
The average number of yearly fire incidents per 10k residents in Little Falls, MN compared to nearest cities:
(Note: Based on data for the last 3 years, including only cities with population 5,000 and above)
| Little Falls: | 74.4 |
| Sartell: | 5.2 |
| Baxter: | 14.5 |
| Brainerd: | 62.1 |
| Sauk Rapids: | 19.7 |
| Waite Park: | 56.7 |
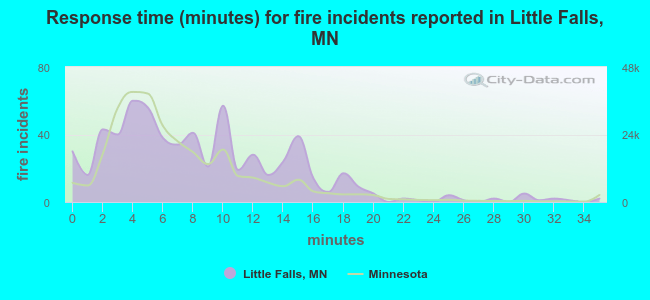 The median response time based on all reported fire incidents is 8 minutes. This is higher than the state median value.
The median response time in Little Falls, MN compared to nearest cities:
(Note: Based on data for all years, including only cities with at least 500 fire incidents)
| Little Falls: | 8 minutes |
| Brainerd: | 8 minutes |
| Sauk Rapids: | 8 minutes |
| Waite Park: | 6 minutes |
| Foley: | 11 minutes |
| Milaca: | 12 minutes |
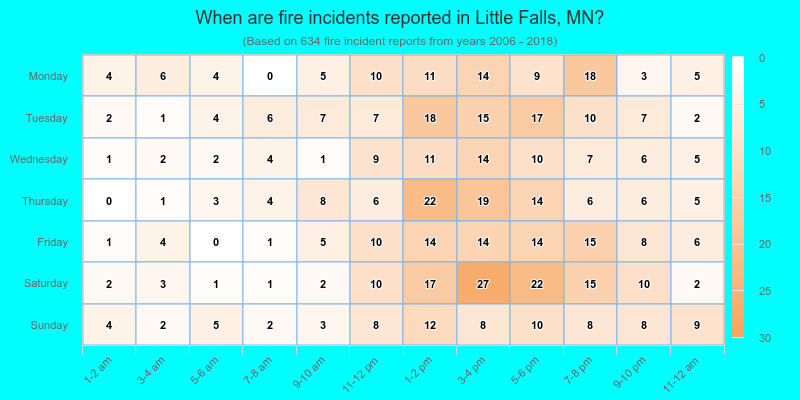
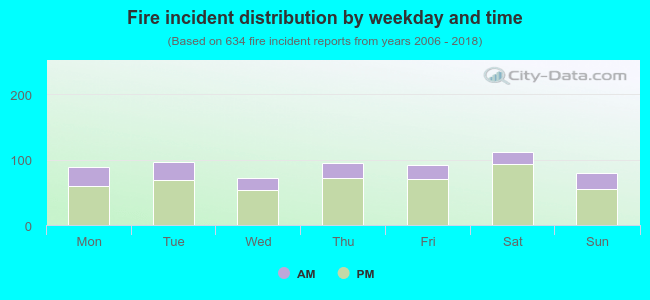 25.4% incidents where reported in the morning and 74.6% in the evening. The most fires (17.7%) took place on Saturday, and the least (11.4%) on Wednesday.
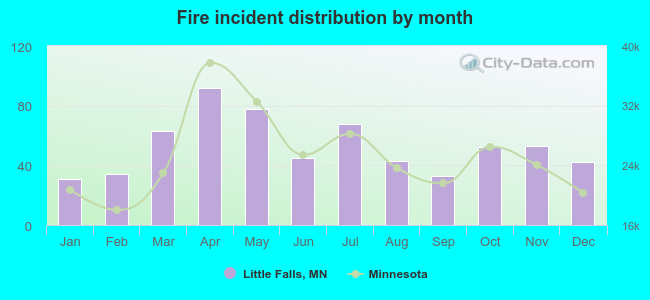 Based on the 634 fires from years 2006 - 2018 most fires (14.5%) took place during April, and the least (4.9%) in January.
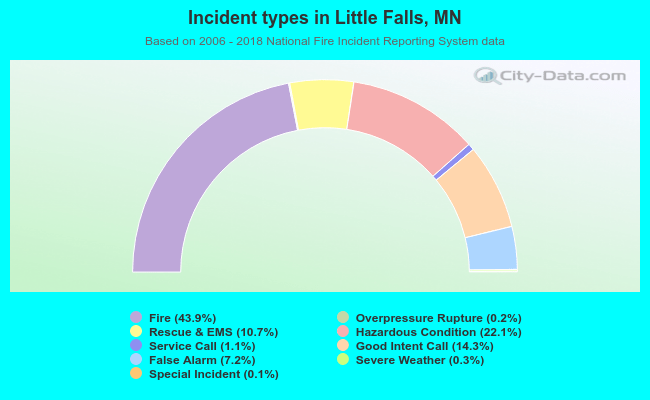 Out of all 1,443 cases reported during the years 2006 - 2018, the most belonged to the categories: Fire (43.9%), Hazardous Condition (22.1%), and Good Intent Call (14.3%).
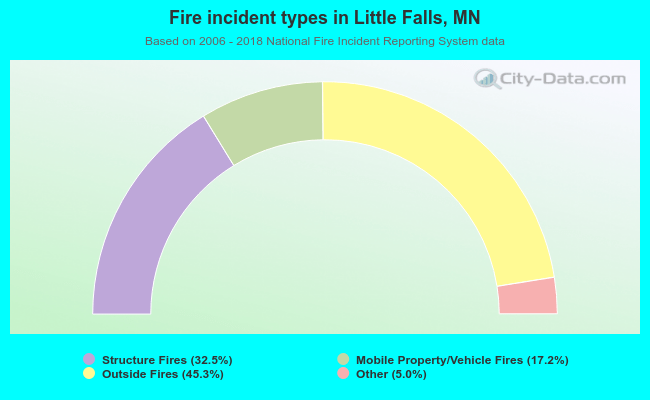 When looking into fire subcategories, the most incidents belonged to: Outside Fires (45.3%), and Structure Fires (32.5%).