Brainerd: Fire Incidents, Minnesota (MN)
Where are fire incidents reported in Brainerd, MN
Something went wrong! Please refresh the page.
| Fire incidents reported | |
|---|---|
| Sreet name | Count |
| LAUREL ST | 80 |
| WASHINGTON ST | 78 |
| 7TH ST | 62 |
| 6TH ST | 60 |
| OAK ST | 58 |
| 371 HWY | 54 |
| 8TH ST | 54 |
| 10TH ST | 50 |
| 9TH ST | 50 |
| PINE ST | 44 |
| 5TH ST | 40 |
| HWY #371 | 40 |
| ROOSEVELT | 38 |
| 13TH ST | 36 |
| GARRISON | 34 |
| MILL AVE | 32 |
| NORWOOD ST | 32 |
| 4TH AVE | 26 |
| 4TH ST | 26 |
| HWY #25 | 24 |
| COUNTY 45 RD | 22 |
| EDGEWOOD DR | 22 |
| HWY #210 | 22 |
| ST MATHIAS RD | 22 |
| FIVE MILE RD | 20 |
| FRONT ST | 20 |
| HWY #18 | 20 |
| INDUSTRIAL PARK RD | 20 |
| MAPLE ST | 20 |
| RIVER RD | 20 |
| Other | 584 |
2002 - 2018 National Fire Incident Reporting System (NFIRS) incidents
- Incident types reported to NFIRS in Brainerd, MN
- 1,71036.5%Fire
- 83717.9%Hazardous Condition
- 68414.6%Good Intent Call
- 56612.1%Rescue & EMS
- 55211.8%False Alarm
- 2936.3%Service Call
- 150.3%Special Incident
- 130.3%Overpressure Rupture
- 130.3%Severe Weather
- Fire incident types reported to NFIRS in Brainerd, MN
- 72142.2%Structure Fires
- 62536.5%Outside Fires
- 35020.5%Mobile Property/Vehicle Fires
- 140.8%Other
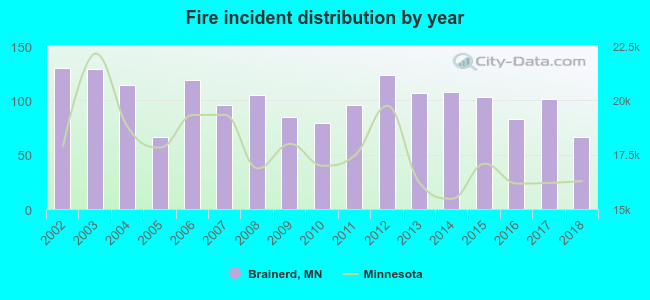 According to the data from the years 2002 - 2018 the average number of fire incidents per year is 101. The highest number of reported fires - 130 took place in 2002, and the least - 66 in 2005. The data has a dropping trend.
The average number of yearly fire incidents per 10k residents in Brainerd, MN compared to nearest cities:
(Note: Based on data for the last 3 years, including only cities with population 5,000 and above)
| Brainerd: | 62.1 |
| Baxter: | 14.5 |
| Little Falls: | 74.4 |
| Sartell: | 5.2 |
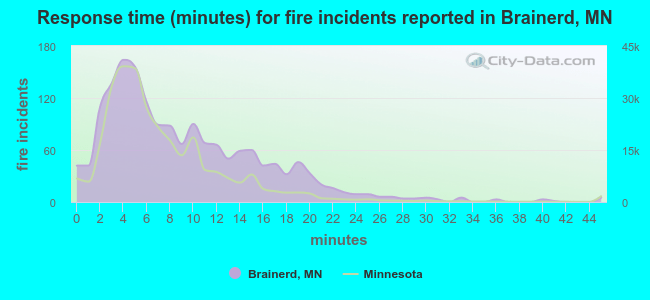 The median response time based on all reported fire incidents is 8 minutes. This is higher compared to the state median value.
The median response time in Brainerd, MN compared to nearest cities:
(Note: Based on data for all years, including only cities with at least 500 fire incidents)
| Brainerd: | 8 minutes |
| Little Falls: | 8 minutes |
| Milaca: | 12 minutes |
| Foley: | 11 minutes |
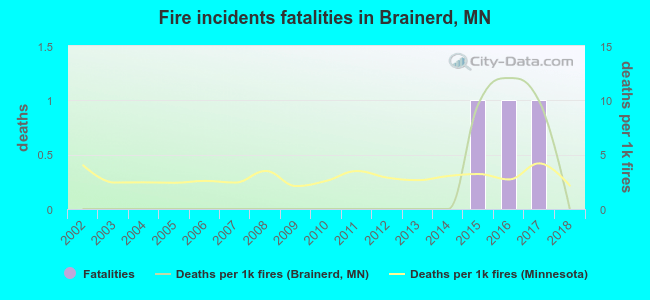 Based on the reports from the years 2002 - 2018 the average number of fire-related yearly deaths is 0. The highest number of deaths - 1 took place in 2015, and the lowest - 0 in 2002. The data has a constant trend.
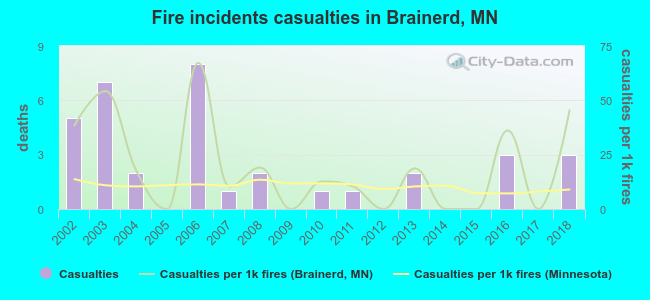 Based on the reports from the years 2002 - 2018 the average number of fire-related casualties per year is 2. The highest number of casualties - 8 took place in 2006, and the lowest - 0 in 2005. The data has a decreasing trend.
The average number of injuries per 1,000 fires is 19. This indicator was the highest - 67 in 2006, and the lowest 0 in 2005. The trend for casualties per 1,000 incidents is increasing. Compared to the state value the number of injuries per 1,000 fires is higher.
Based on the reports from the years 2002 - 2018 the average number of fire-related casualties per year is 2. The highest number of casualties - 8 took place in 2006, and the lowest - 0 in 2005. The data has a decreasing trend.
The average number of injuries per 1,000 fires is 19. This indicator was the highest - 67 in 2006, and the lowest 0 in 2005. The trend for casualties per 1,000 incidents is increasing. Compared to the state value the number of injuries per 1,000 fires is higher.Casualties per 1,000 incidents in Brainerd, MN compared to nearest cities:
(Note: Based on data for all years, including only cities with at least 500 fire incidents)
| Brainerd: | 20.5 |
| Little Falls: | 0.0 |
| Milaca: | 9.5 |
| Foley: | 14.9 |
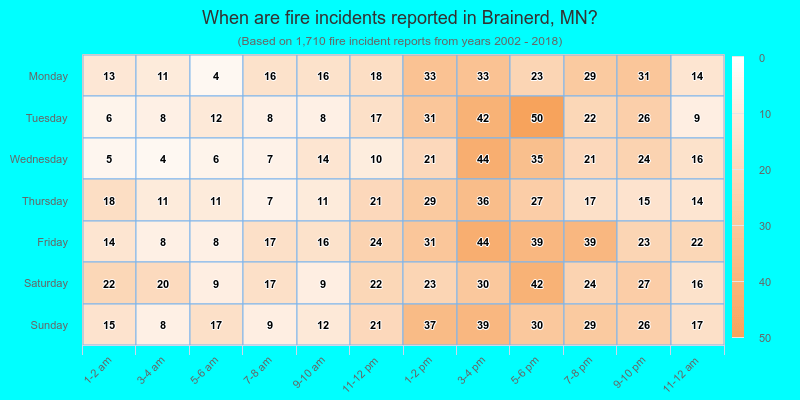
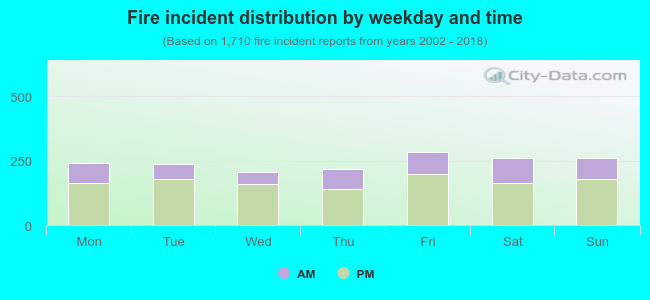 31.0% incidents where reported in the morning and 69.0% in the evening. The most fires (16.7%) took place on Friday, and the least (12.1%) on Wednesday.
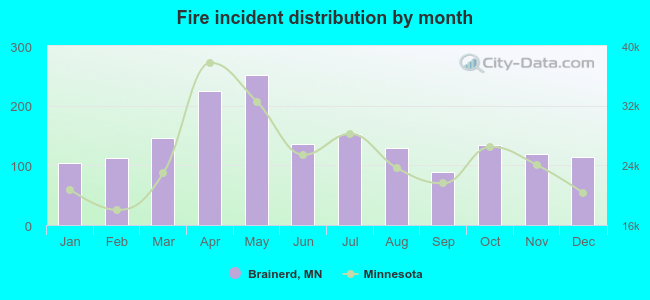 Based on the 1,710 reports from years 2002 - 2018 most fires (14.7%) took place during May, and the least (5.2%) in September.
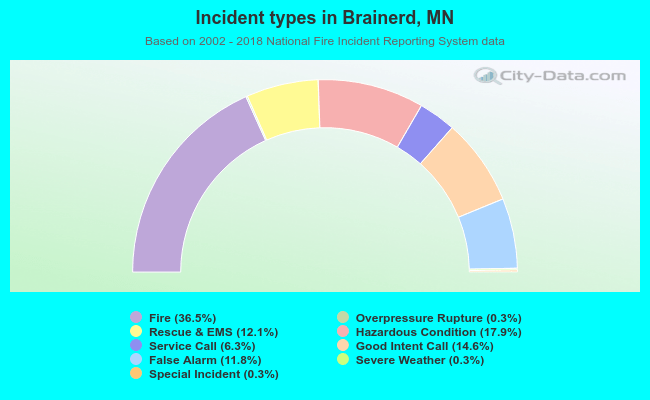 Out of all 4,683 cases reported during the years 2002 - 2018, the most belonged to the categories: Fire (36.5%), Hazardous Condition (17.9%), and Good Intent Call (14.6%).
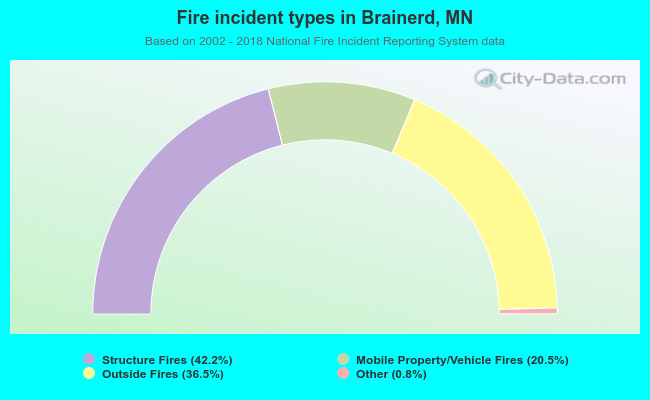 When looking into fire subcategories, the most incidents belonged to: Structure Fires (42.2%), and Outside Fires (36.5%).