Liberty: Fire Incidents, Texas (TX)
Where are fire incidents reported in Liberty, TX
Something went wrong! Please refresh the page.
| Fire incidents reported | |
|---|---|
| Sreet name | Count |
| HIGHWAY 90 HWY | 200 |
| MAIN ST | 114 |
| MAIN | 48 |
| BEAUMONT AVE | 46 |
| FM 160 FM | 44 |
| TANTON LOOP | 42 |
| HWY 90 | 40 |
| RIVER BEND RD | 40 |
| TRAVIS | 34 |
| FM 563 | 32 |
| PECAN LOOP | 30 |
| SAN JACINTO | 26 |
| COS ST | 24 |
| FM 563 FM | 24 |
| MILAM | 24 |
| WASHINGTON | 24 |
| BOWIE ST | 22 |
| COOK | 22 |
| FM 2684 FM | 22 |
| GLENN ST | 22 |
| MINGLEWOOD | 22 |
| CONFEDERATE | 20 |
| FM 2684 | 20 |
| HIGHWAY 146 BYPASS BYP | 20 |
| HIGHWAY 146 HWY | 20 |
| WALLISVILLE RD | 20 |
| BEAUMONT | 18 |
| FM 563 HWY | 18 |
| LAYL | 18 |
| TRINITY | 18 |
| Other | 311 |
2002 - 2018 National Fire Incident Reporting System (NFIRS) incidents
- Incident types reported to NFIRS in Liberty, TX
- 1,44534.0%Hazardous Condition
- 1,38532.6%Fire
- 49811.7%Service Call
- 4019.4%Rescue & EMS
- 3307.8%False Alarm
- 1684.0%Good Intent Call
- 90.2%Special Incident
- 50.1%Overpressure Rupture
- 50.1%Severe Weather
- Fire incident types reported to NFIRS in Liberty, TX
- 70350.8%Outside Fires
- 35325.5%Structure Fires
- 19914.4%Mobile Property/Vehicle Fires
- 1309.4%Other
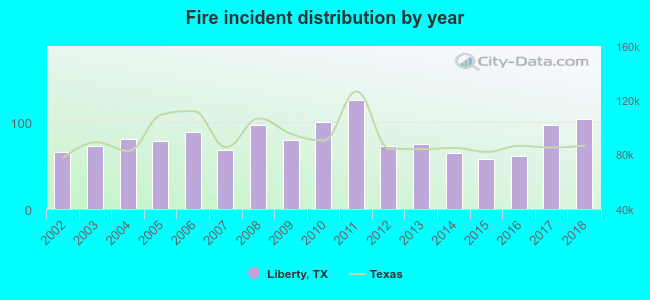 Based on the data from the years 2002 - 2018 the average number of fires per year is 81. The highest number of reported fires - 125 took place in 2011, and the least - 58 in 2015. The data has a rising trend.
The average number of yearly fire incidents per 10k residents in Liberty, TX compared to nearest cities:
(Note: Based on data for the last 3 years, including only cities with population 5,000 and above)
| Liberty: | 97.5 |
| Dayton: | 77.7 |
| Highlands: | 192.3 |
| Atascocita: | 1.4 |
| Baytown: | 41.1 |
| Cleveland: | 466.1 |
| Channelview: | 55.4 |
| Humble: | 217.5 |
| Cloverleaf: | 0.6 |
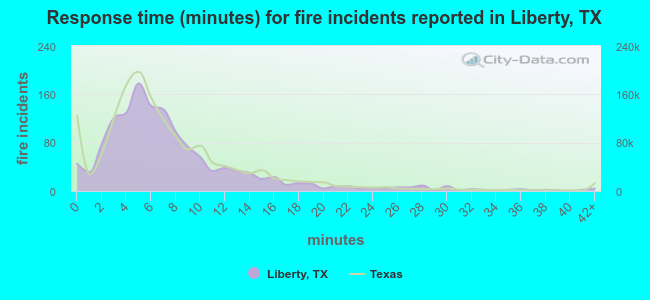 The median response time based on all reported fire incidents is 6 minutes. This is comparable to the Texas median value.
The median response time in Liberty, TX compared to nearest cities:
(Note: Based on data for all years, including only cities with at least 500 fire incidents)
| Liberty: | 6 minutes |
| Dayton: | 8 minutes |
| Crosby: | 11 minutes |
| Highlands: | 7 minutes |
| Baytown: | 5 minutes |
| Splendora: | 10 minutes |
| Cleveland: | 10 minutes |
| Channelview: | 7 minutes |
| Humble: | 7 minutes |
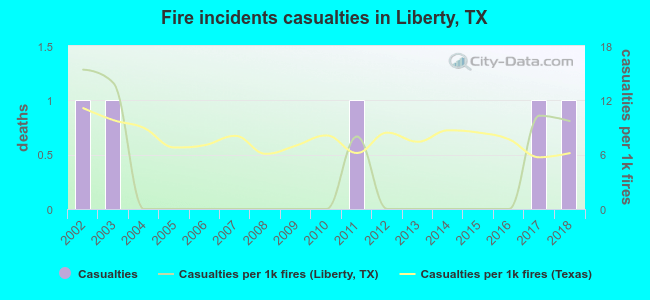 Based on the reports from the years 2002 - 2018 the average number of fire-related casualties per year is 0. The highest number of reported injuries - 1 took place in 2002, and the lowest - 0 in 2004. The data has a constant trend.
The average number of injuries per 1,000 fire incidents is 3. This indicator was the highest - 15 in 2002, and the lowest 0 in 2004. The trend for injuries per 1,000 fires is dropping. Compared to the state value the number of casualties per 1,000 fire incidents is much lower.
Based on the reports from the years 2002 - 2018 the average number of fire-related casualties per year is 0. The highest number of reported injuries - 1 took place in 2002, and the lowest - 0 in 2004. The data has a constant trend.
The average number of injuries per 1,000 fire incidents is 3. This indicator was the highest - 15 in 2002, and the lowest 0 in 2004. The trend for injuries per 1,000 fires is dropping. Compared to the state value the number of casualties per 1,000 fire incidents is much lower.
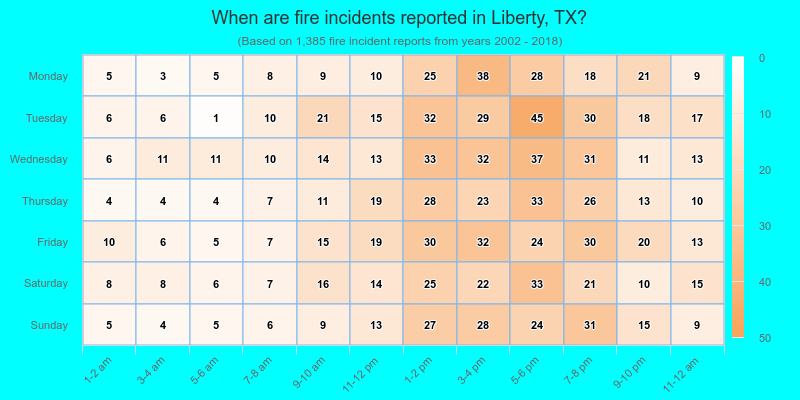
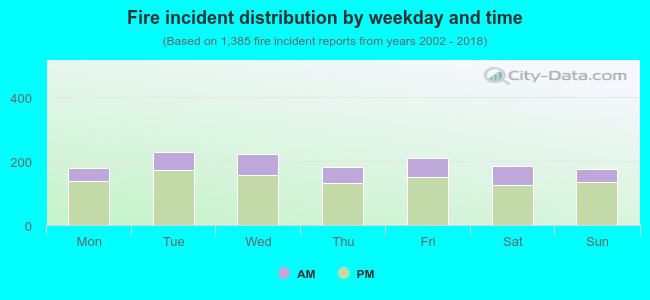 27.1% incidents where reported in the morning and 72.9% in the evening. The most fires (16.6%) took place on Tuesday, and the least (12.7%) on Sunday.
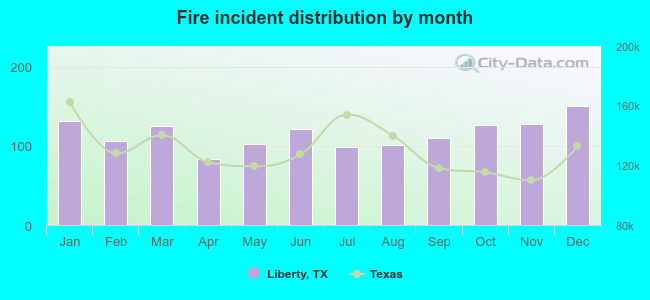 Based on the 1,385 fire incidents from years 2002 - 2018 most fires (10.9%) took place during December, and the least (6.0%) in April.
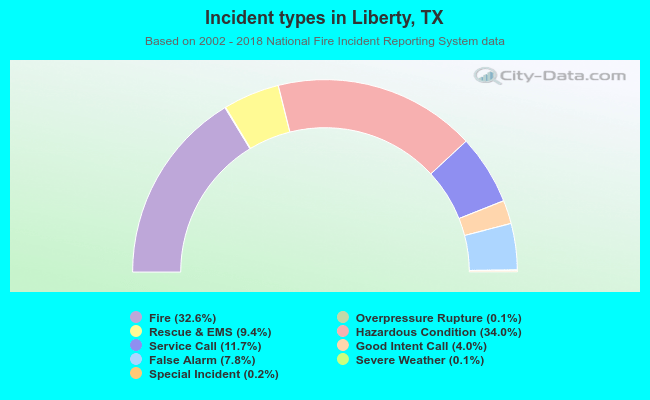 Out of all 4,246 cases reported during the years 2002 - 2018, the most belonged to the categories: Hazardous Condition (34.0%), Fire (32.6%), and Service Call (11.7%).
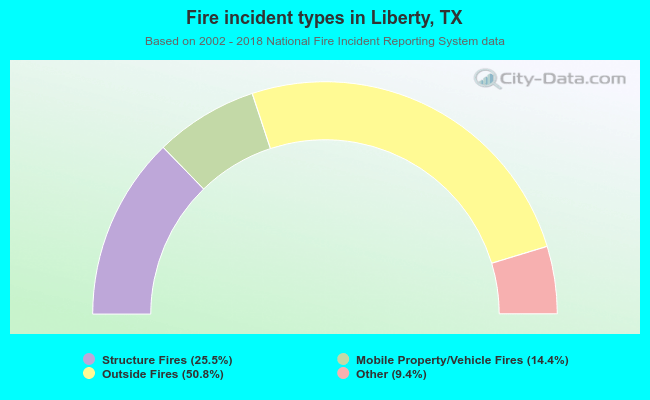 When looking into fire subcategories, the most incidents belonged to: Outside Fires (50.8%), and Structure Fires (25.5%).