Dayton: Fire Incidents, Texas (TX)
Where are fire incidents reported in Dayton, TX
Something went wrong! Please refresh the page.
|
| |||||||||||||||||||||||||||||||||||||||||||||||||||||||||||||||||||||||||||||||||||||||||||||||||||||||||||||
| Other | 538 | |||||||||||||||||||||||||||||||||||||||||||||||||||||||||||||||||||||||||||||||||||||||||||||||||||||||||||||
2003 - 2018 National Fire Incident Reporting System (NFIRS) incidents
- Incident types reported to NFIRS in Dayton, TX
- 1,23654.3%Fire
- 46920.6%Rescue & EMS
- 38917.1%Hazardous Condition
- 843.7%Service Call
- 763.3%Good Intent Call
- 160.7%False Alarm
- 60.3%Severe Weather
- Fire incident types reported to NFIRS in Dayton, TX
- 72258.4%Outside Fires
- 32626.4%Structure Fires
- 1038.3%Mobile Property/Vehicle Fires
- 856.9%Other
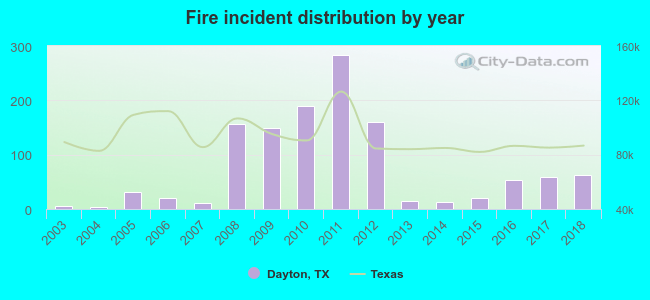 According to the data from the years 2003 - 2018 the average number of fires per year is 77. The highest number of fire incidents - 284 took place in 2011, and the least - 4 in 2004. The data has a growing trend.
The average number of yearly fire incidents per 10k residents in Dayton, TX compared to nearest cities:
(Note: Based on data for the last 3 years, including only cities with population 5,000 and above)
| Dayton: | 77.7 |
| Liberty: | 97.5 |
| Atascocita: | 1.4 |
| Highlands: | 192.3 |
| Baytown: | 41.1 |
| Humble: | 217.5 |
| Cleveland: | 466.1 |
| Channelview: | 55.4 |
| Cloverleaf: | 0.6 |
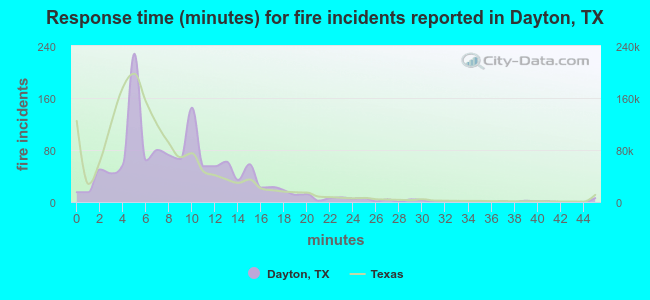 The median response time based on all reported fire incidents is 8 minutes. This is higher than the state median value.
The median response time in Dayton, TX compared to nearest cities:
(Note: Based on data for all years, including only cities with at least 500 fire incidents)
| Dayton: | 8 minutes |
| Liberty: | 6 minutes |
| Crosby: | 11 minutes |
| Highlands: | 7 minutes |
| Splendora: | 10 minutes |
| Baytown: | 5 minutes |
| Humble: | 7 minutes |
| Cleveland: | 10 minutes |
| Channelview: | 7 minutes |
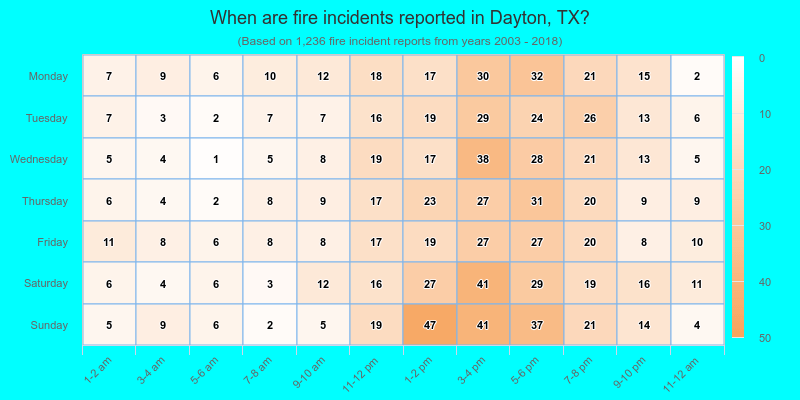
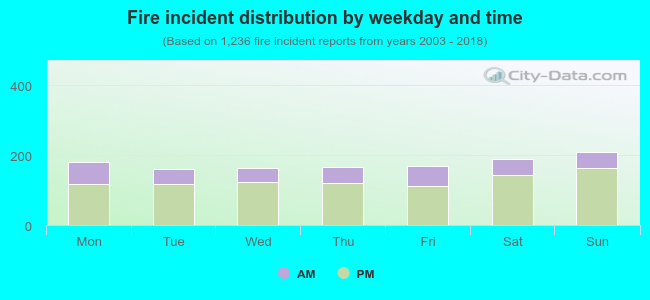 27.8% incidents where reported in the morning and 72.2% in the evening. The most fires (17.0%) took place on Sunday, and the least (12.9%) on Tuesday.
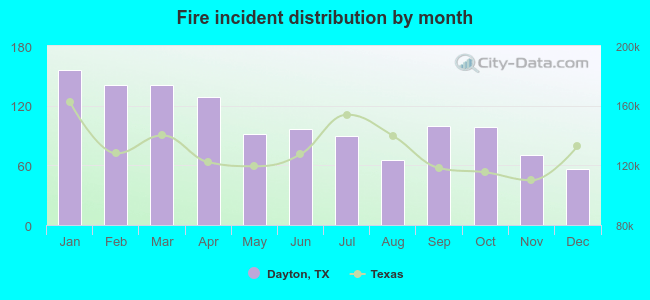 Based on the 1,236 fire incident reports from years 2003 - 2018 most fires (12.6%) took place during January, and the least (4.5%) in December.
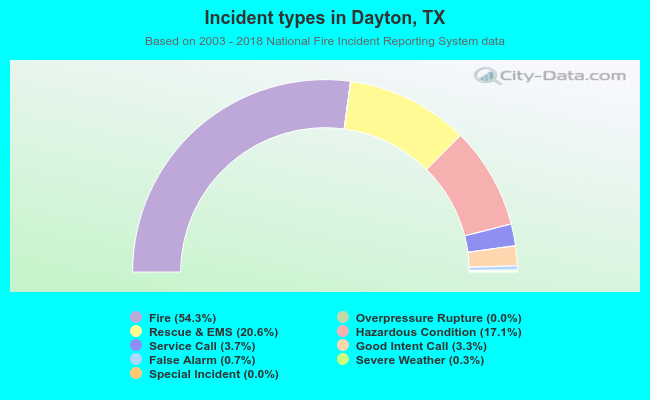 Out of all 2,278 cases reported during the years 2003 - 2018, the most belonged to the categories: Fire (54.3%), Rescue & EMS (20.6%), and Hazardous Condition (17.1%).
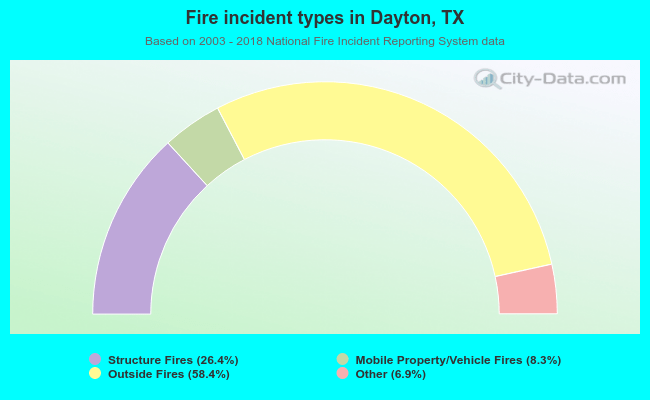 When looking into fire subcategories, the most reports belonged to: Outside Fires (58.4%), and Structure Fires (26.4%).