Lenexa: Fire Incidents, Kansas (KS)
Where are fire incidents reported in Lenexa, KS
Something went wrong! Please refresh the page.
| Fire incidents reported | |
|---|---|
| Sreet name | Count |
| RENNER BLVD | 180 |
| 95TH ST | 146 |
| HALSEY ST | 128 |
| MONROVIA ST | 120 |
| QUIVIRA RD | 94 |
| SANTA FE TRAIL DR | 86 |
| LACKMAN RD | 84 |
| PFLUMM RD | 82 |
| 83RD ST | 78 |
| LICHTENAUER DR | 70 |
| 87TH ST PKWY | 60 |
| 97TH TER | 54 |
| ROSEHILL RD | 52 |
| 87TH ST | 50 |
| 99TH ST | 50 |
| COLLEGE BLVD | 50 |
| LENEXA DR | 50 |
| 87TH ST PKWY | 44 |
| HASKINS ST | 44 |
| 88TH CIR | 42 |
| 92ND ST | 38 |
| CHARLES ST | 36 |
| PFLUMM CT | 36 |
| 96TH TER | 34 |
| NOLAND RD | 34 |
| 108TH ST | 32 |
| 77TH ST | 32 |
| 78TH TER | 32 |
| I35 HWY | 32 |
| K10 HWY | 32 |
| Other | 620 |
2002 - 2018 National Fire Incident Reporting System (NFIRS) incidents
- Incident types reported to NFIRS in Lenexa, KS
- 17,10158.3%Rescue & EMS
- 2,8529.7%Good Intent Call
- 2,5688.8%False Alarm
- 2,5618.7%Hazardous Condition
- 2,5228.6%Fire
- 1,5775.4%Service Call
- 1300.4%Overpressure Rupture
- Fire incident types reported to NFIRS in Lenexa, KS
- 97538.7%Outside Fires
- 92936.8%Structure Fires
- 52720.9%Mobile Property/Vehicle Fires
- 913.6%Other
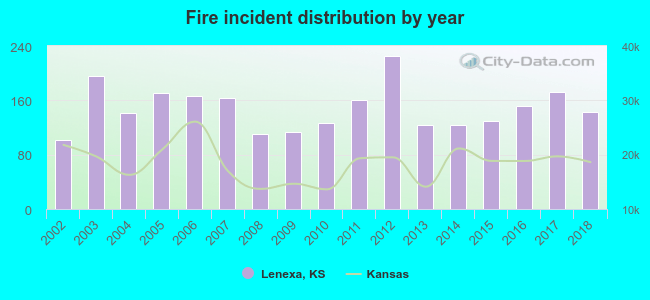 According to the data from the years 2002 - 2018 the average number of fires per year is 148. The highest number of fires - 225 took place in 2012, and the least - 102 in 2002. The data has a rising trend.
The average number of yearly fire incidents per 10k residents in Lenexa, KS compared to nearest cities:
(Note: Based on data for the last 3 years, including only cities with population 5,000 and above)
| Lenexa: | 30.4 |
| Shawnee: | 23.6 |
| Overland Park: | 21.0 |
| Merriam: | 38.7 |
| Olathe: | 21.1 |
| Prairie Village: | 14.3 |
| Mission: | 28.1 |
| Leawood: | 17.8 |
| Roeland Park: | 22.9 |
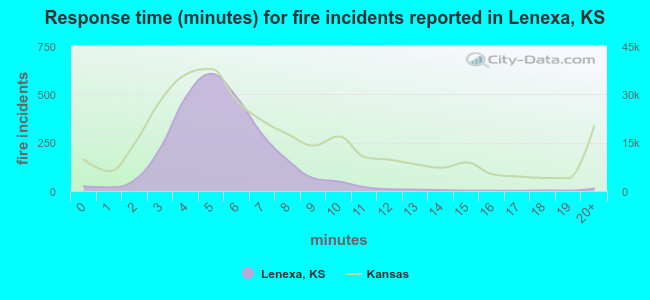 The median response time based on all reported fire incidents is 5 minutes. This is lower compared to the Kansas median value.
The median response time in Lenexa, KS compared to nearest cities:
(Note: Based on data for all years, including only cities with at least 500 fire incidents)
| Lenexa: | 5 minutes |
| Shawnee: | 6 minutes |
| Overland Park: | 6 minutes |
| Merriam: | 5 minutes |
| Olathe: | 5 minutes |
| Leawood: | 5 minutes |
| Bonner Springs: | 8 minutes |
| Kansas City: | 5 minutes |
| Gardner: | 6 minutes |
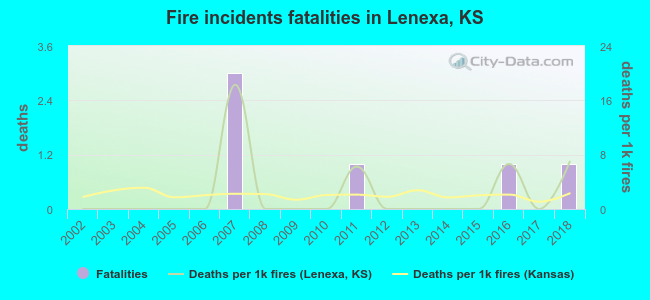 Based on the reports from the years 2002 - 2018 the average number of fire-related fatalities per year is 0. The highest number of reported deaths - 3 took place in 2007, and the lowest - 0 in 2002. The data has an increasing trend.
The average number of fatalities per 1,000 fire incidents is 2. This indicator was the highest - 18 in 2007, and the lowest 0 in 2002. The trend for deaths per 1,000 fires is increasing. Compared to the Kansas value the number of deaths per 1,000 fire incidents is similar.
Based on the reports from the years 2002 - 2018 the average number of fire-related fatalities per year is 0. The highest number of reported deaths - 3 took place in 2007, and the lowest - 0 in 2002. The data has an increasing trend.
The average number of fatalities per 1,000 fire incidents is 2. This indicator was the highest - 18 in 2007, and the lowest 0 in 2002. The trend for deaths per 1,000 fires is increasing. Compared to the Kansas value the number of deaths per 1,000 fire incidents is similar.Deaths per 1,000 incidents in Lenexa, KS compared to nearest cities:
(Note: Based on data for all years, including only cities with at least 2,500 fire incidents)
| Lenexa: | 2.4 |
| Overland Park: | 3.3 |
| Olathe: | 2.9 |
| Kansas City: | 4.0 |
| Leavenworth: | 1.6 |
| Lawrence: | 0.5 |
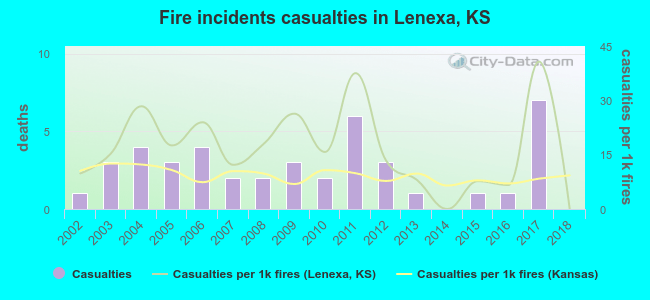 Based on the data from the years 2002 - 2018 the average number of fire-related casualties per year is 3. The highest number of reported injuries - 7 took place in 2017, and the lowest - 0 in 2014. The data has a dropping trend.
The average number of injuries per 1,000 fires is 17. This indicator was the highest - 41 in 2017, and the lowest 0 in 2014. The trend for injuries per 1,000 fire incidents is declining. Compared to the state value the number of casualties per 1,000 fire incidents is higher.
Based on the data from the years 2002 - 2018 the average number of fire-related casualties per year is 3. The highest number of reported injuries - 7 took place in 2017, and the lowest - 0 in 2014. The data has a dropping trend.
The average number of injuries per 1,000 fires is 17. This indicator was the highest - 41 in 2017, and the lowest 0 in 2014. The trend for injuries per 1,000 fire incidents is declining. Compared to the state value the number of casualties per 1,000 fire incidents is higher.Casualties per 1,000 incidents in Lenexa, KS compared to nearest cities:
(Note: Based on data for all years, including only cities with at least 500 fire incidents)
| Lenexa: | 17.0 |
| Shawnee: | 18.6 |
| Overland Park: | 25.7 |
| Merriam: | 9.6 |
| Olathe: | 17.6 |
| Leawood: | 8.3 |
| Bonner Springs: | 5.5 |
| Kansas City: | 13.3 |
| Gardner: | 6.3 |
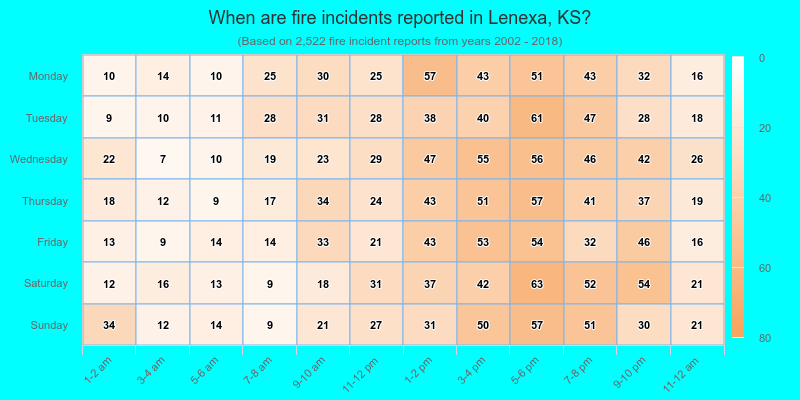
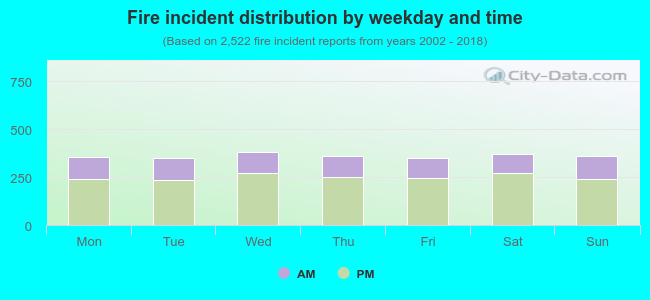 30.7% incidents where reported in the morning and 69.3% in the evening. The most fires (15.1%) took place on Wednesday, and the least (13.8%) on Friday.
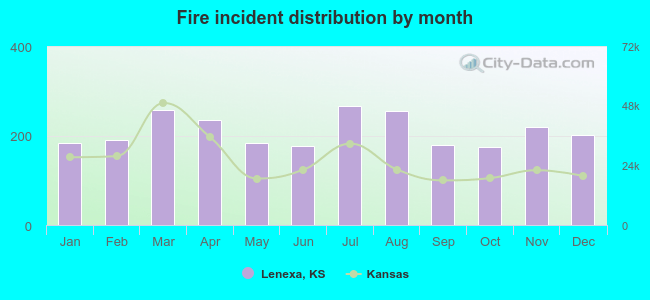 Based on the 2,522 incident reports from years 2002 - 2018 most fires (10.6%) took place during July, and the least (6.9%) in October.
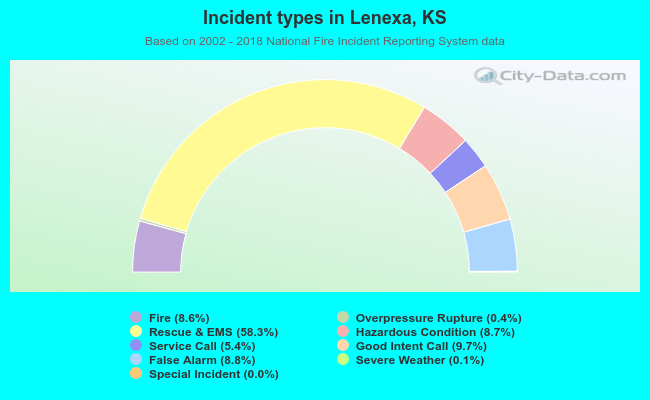 Out of all 29,341 cases reported during the years 2002 - 2018, the most belonged to the categories: Rescue & EMS (58.3%), Good Intent Call (9.7%), and False Alarm (8.8%).
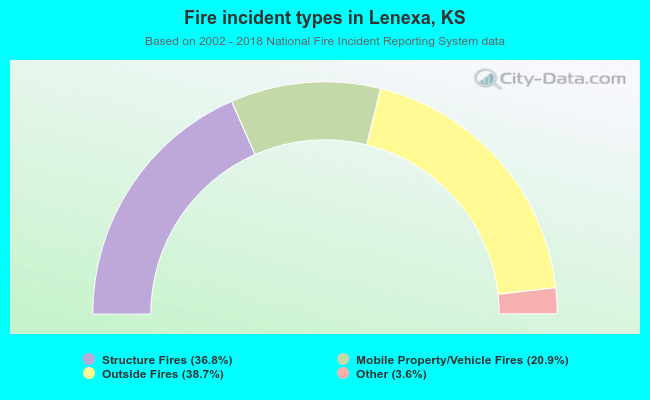 When looking into fire subcategories, the most reports belonged to: Outside Fires (38.7%), and Structure Fires (36.8%).