Kansas City: Fire Incidents, Kansas (KS)
Where are fire incidents reported in Kansas City, KS
Something went wrong! Please refresh the page.
| Fire incidents reported | |
|---|---|
| Sreet name | Count |
| STATE AVE | 382 |
| LEAVENWORTH RD | 298 |
| 18TH ST | 252 |
| 10TH ST | 240 |
| KANSAS AVE | 238 |
| 11TH ST | 186 |
| 55TH ST | 182 |
| MILL ST | 178 |
| STATE AV | 168 |
| 12TH ST | 158 |
| PARALLEL PKWY | 158 |
| 13TH ST | 138 |
| 32ND ST | 138 |
| 9TH ST | 134 |
| 38TH ST | 122 |
| CENTRAL AVE | 122 |
| 8TH ST | 118 |
| GEORGIA AVE | 118 |
| 16TH ST | 116 |
| METROPOLITAN AVE | 114 |
| 26TH ST | 112 |
| WOOD AVE | 110 |
| GREELEY AVE | 108 |
| HASKELL AVE | 108 |
| KAW DR | 108 |
| MERRIAM LN | 108 |
| 34TH ST | 106 |
| 5TH ST | 106 |
| MINNESOTA AVE | 106 |
| 29TH ST | 104 |
| Other | 6,563 |
2002 - 2018 National Fire Incident Reporting System (NFIRS) incidents
- Incident types reported to NFIRS in Kansas City, KS
- 107,22067.2%Rescue & EMS
- 14,7089.2%Service Call
- 11,1997.0%Fire
- 10,8686.8%Good Intent Call
- 8,2735.2%False Alarm
- 7,0764.4%Hazardous Condition
- Fire incident types reported to NFIRS in Kansas City, KS
- 4,51840.3%Structure Fires
- 3,45030.8%Mobile Property/Vehicle Fires
- 2,94926.3%Outside Fires
- 2822.5%Other
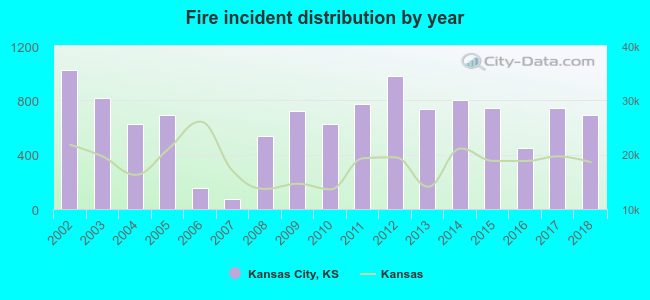 Based on the data from the years 2002 - 2018 the average number of fires per year is 659. The highest number of fires - 1,025 took place in 2002, and the least - 73 in 2007. The data has a decreasing trend.
The average number of yearly fire incidents per 10k residents in Kansas City, KS compared to nearest cities:
(Note: Based on data for the last 3 years, including only cities with population 5,000 and above)
| Kansas City: | 42.0 |
| Roeland Park: | 22.9 |
| Mission: | 28.1 |
| Merriam: | 38.7 |
| Shawnee: | 23.6 |
| Prairie Village: | 14.3 |
| Lenexa: | 30.4 |
| Bonner Springs: | 50.3 |
| Overland Park: | 21.0 |
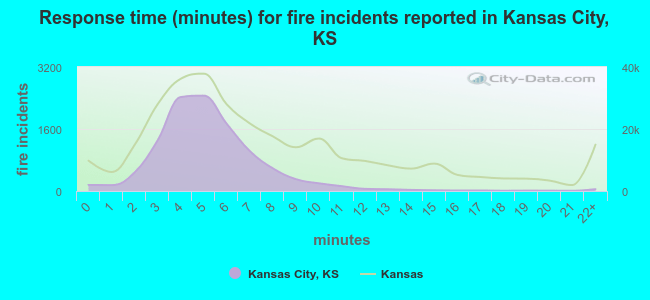 The median response time based on all reported fire incidents is 5 minutes. This is lower than the Kansas median value.
The median response time in Kansas City, KS compared to nearest cities:
(Note: Based on data for all years, including only cities with at least 500 fire incidents)
| Kansas City: | 5 minutes |
| Merriam: | 5 minutes |
| Shawnee: | 6 minutes |
| Lenexa: | 5 minutes |
| Bonner Springs: | 8 minutes |
| Overland Park: | 6 minutes |
| Leawood: | 5 minutes |
| Basehor: | 7 minutes |
| Lansing: | 6 minutes |
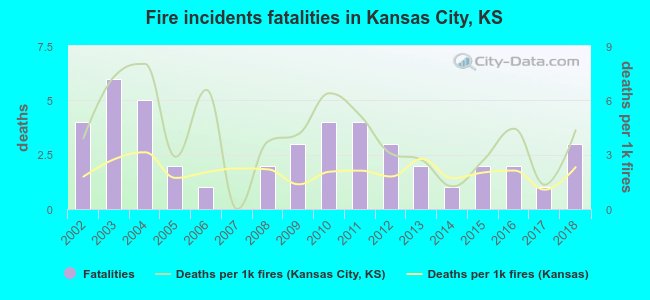 According to the reports from the years 2002 - 2018 the average number of fire-related fatalities per year is 3. The highest number of reported deaths - 6 took place in 2003, and the lowest - 0 in 2007. The data has a decreasing trend.
The average number of deaths per 1,000 fire incidents is 4. This indicator was the highest - 8 in 2004, and the lowest 0 in 2007. The trend for fatalities per 1,000 fires is rising. Compared to the Kansas value the number of deaths per 1,000 fire incidents is higher.
According to the reports from the years 2002 - 2018 the average number of fire-related fatalities per year is 3. The highest number of reported deaths - 6 took place in 2003, and the lowest - 0 in 2007. The data has a decreasing trend.
The average number of deaths per 1,000 fire incidents is 4. This indicator was the highest - 8 in 2004, and the lowest 0 in 2007. The trend for fatalities per 1,000 fires is rising. Compared to the Kansas value the number of deaths per 1,000 fire incidents is higher.Deaths per 1,000 incidents in Kansas City, KS compared to nearest cities:
(Note: Based on data for all years, including only cities with at least 2,500 fire incidents)
| Kansas City: | 4.0 |
| Lenexa: | 2.4 |
| Overland Park: | 3.3 |
| Olathe: | 2.9 |
| Leavenworth: | 1.6 |
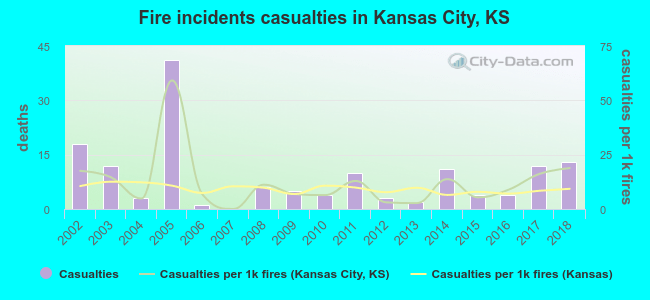 Based on the reports from the years 2002 - 2018 the average number of fire-related yearly casualties is 9. The highest number of casualties - 41 took place in 2005, and the lowest - 0 in 2007. The data has a decreasing trend.
The average number of casualties per 1,000 fires is 12. This indicator was the highest - 59 in 2005, and the lowest 0 in 2007. The trend for casualties per 1,000 incidents is growing. Compared to the state value the number of casualties per 1,000 fires is higher.
Based on the reports from the years 2002 - 2018 the average number of fire-related yearly casualties is 9. The highest number of casualties - 41 took place in 2005, and the lowest - 0 in 2007. The data has a decreasing trend.
The average number of casualties per 1,000 fires is 12. This indicator was the highest - 59 in 2005, and the lowest 0 in 2007. The trend for casualties per 1,000 incidents is growing. Compared to the state value the number of casualties per 1,000 fires is higher.Casualties per 1,000 incidents in Kansas City, KS compared to nearest cities:
(Note: Based on data for all years, including only cities with at least 500 fire incidents)
| Kansas City: | 13.3 |
| Merriam: | 9.6 |
| Shawnee: | 18.6 |
| Lenexa: | 17.0 |
| Bonner Springs: | 5.5 |
| Overland Park: | 25.7 |
| Leawood: | 8.3 |
| Basehor: | 1.1 |
| Lansing: | 18.6 |
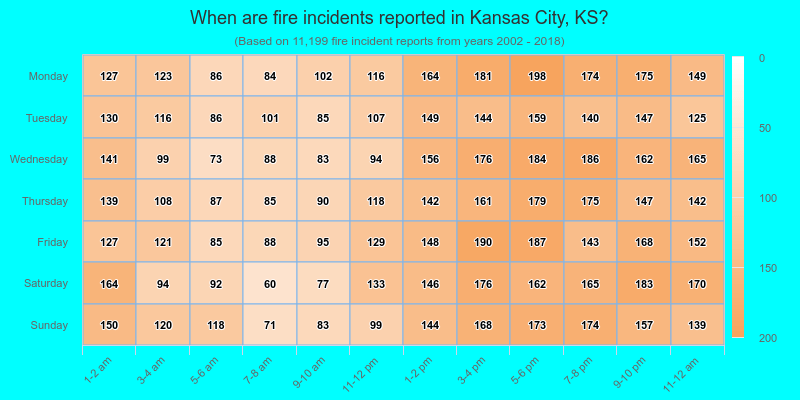
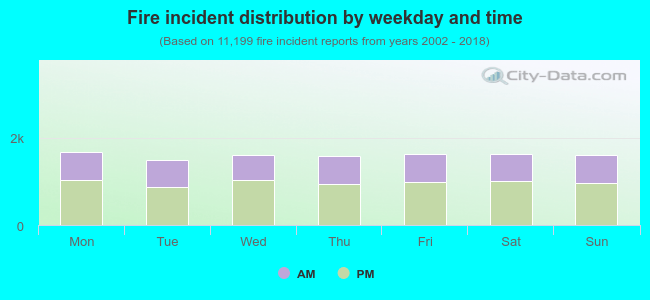 39.1% incidents where reported in the morning and 60.9% in the evening. The most fires (15.0%) took place on Monday, and the least (13.3%) on Tuesday.
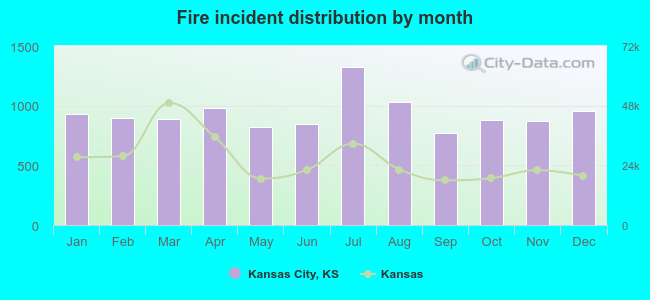 According to the 11,199 reports from years 2002 - 2018 most fires (11.8%) took place during July, and the least (6.9%) in September.
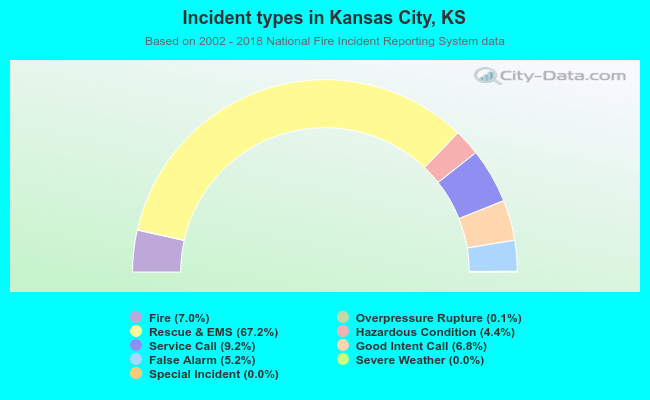 Out of all 159,581 cases reported during the years 2002 - 2018, the most belonged to the categories: Rescue & EMS (67.2%), Service Call (9.2%), and Fire (7.0%).
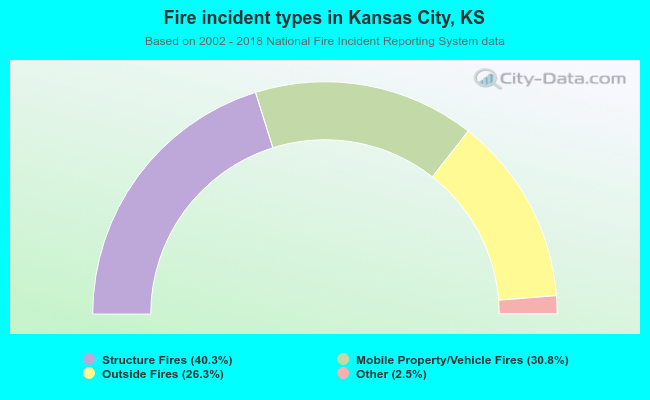 When looking into fire subcategories, the most incidents belonged to: Structure Fires (40.3%), and Mobile Property/Vehicle Fires (30.8%).