Laconia: Fire Incidents, New Hampshire (NH)
Where are fire incidents reported in Laconia, NH
Something went wrong! Please refresh the page.
| Fire incidents reported | |
|---|---|
| Sreet name | Count |
| UNION AVE | 130 |
| ENDICOTT ST | 64 |
| UNION AVENUE (N CENTRAL) AVE | 58 |
| MAIN ST | 54 |
| WEIRS BLVD | 48 |
| UNION AVENUE (S CENTRAL) AVE | 46 |
| BLUEBERRY LN | 42 |
| COURT STREET ST | 42 |
| MEREDITH CENTER RD | 38 |
| PARADE RD | 38 |
| BLUEBERRY LANE <140 LA | 36 |
| COURT ST | 34 |
| ELM ST | 34 |
| MAIN STREET 520-1156 ST | 32 |
| GILFORD AVE | 30 |
| OLD NORTH MAIN ST | 30 |
| UNION AVENUE (SOUTH) AVE | 30 |
| MESSER ST | 28 |
| UNION AV | 26 |
| NORTH MAIN ST | 24 |
| PINE ST | 24 |
| WHITE OAKS ROADNORTH RD | 24 |
| APPLE RIDGE ROAD RD | 22 |
| BLUEBERRY LANE | 22 |
| ENDICOTT STREET NORTH(D1) ST | 22 |
| ENDICOTT STREET NORTH(D2) ST | 22 |
| LAKESIDE AVE | 22 |
| STRAFFORD STREET ST | 22 |
| UNION AVENUE | 22 |
| WEIRS BOULEVARD | 22 |
| Other | 977 |
2002 - 2018 National Fire Incident Reporting System (NFIRS) incidents
- Incident types reported to NFIRS in Laconia, NH
- 14,25058.7%Rescue & EMS
- 2,62910.8%Hazardous Condition
- 2,0658.5%Fire
- 2,0398.4%False Alarm
- 1,7387.2%Good Intent Call
- 1,4405.9%Service Call
- 580.2%Severe Weather
- 260.1%Overpressure Rupture
- Fire incident types reported to NFIRS in Laconia, NH
- 1,34665.2%Structure Fires
- 49123.8%Outside Fires
- 1205.8%Mobile Property/Vehicle Fires
- 1085.2%Other
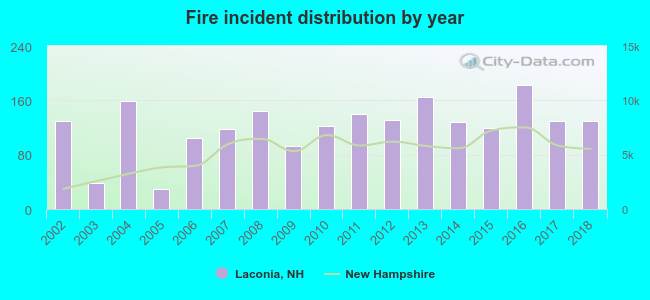 Based on the data from the years 2002 - 2018 the average number of fire incidents per year is 121. The highest number of reported fire incidents - 183 took place in 2016, and the least - 30 in 2005. The data has a constant trend.
The average number of yearly fire incidents per 10k residents in Laconia, NH compared to nearest cities:
(Note: Based on data for the last 3 years, including only cities with population 5,000 and above)
| Laconia: | 91.7 |
| Gilford: | 59.4 |
| Belmont: | 80.2 |
| Franklin: | 67.6 |
| Alton: | 78.7 |
| Loudon: | 96.5 |
| Concord: | 41.9 |
| Wakefield: | 117.5 |
| Pembroke: | 20.6 |
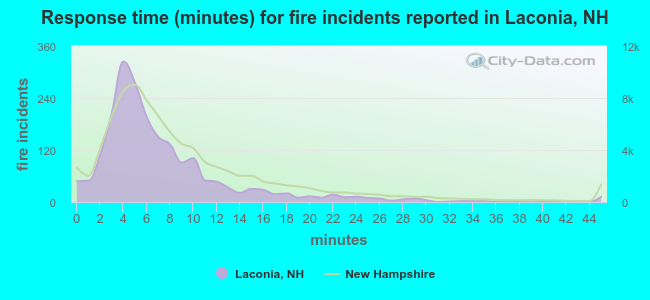 The median response time based on all reported fire incidents is 6 minutes. This is similar to the state median value.
The median response time in Laconia, NH compared to nearest cities:
(Note: Based on data for all years, including only cities with at least 500 fire incidents)
| Laconia: | 6 minutes |
| Gilford: | 8 minutes |
| Belmont: | 9 minutes |
| Sanbornton: | 12 minutes |
| Meredith: | 7 minutes |
| Tilton: | 7 minutes |
| Northfield: | 8 minutes |
| Franklin: | 7 minutes |
| Alton: | 14 minutes |
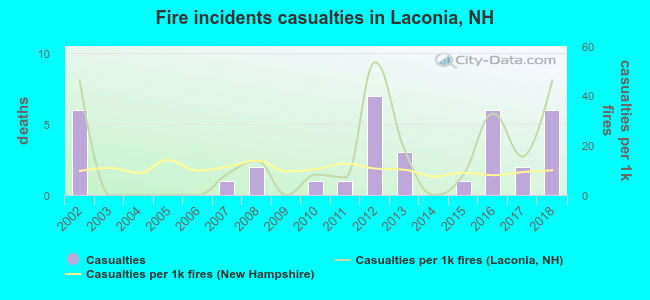 Based on the reports from the years 2002 - 2018 the average number of fire-related casualties per year is 2. The highest number of casualties - 7 took place in 2012, and the lowest - 0 in 2003. The data has a constant trend.
The average number of casualties per 1,000 fires is 15. This indicator was the highest - 53 in 2012, and the lowest 0 in 2003. The trend for injuries per 1,000 fire incidents is constant. Compared to the state value the number of casualties per 1,000 incidents is higher.
Based on the reports from the years 2002 - 2018 the average number of fire-related casualties per year is 2. The highest number of casualties - 7 took place in 2012, and the lowest - 0 in 2003. The data has a constant trend.
The average number of casualties per 1,000 fires is 15. This indicator was the highest - 53 in 2012, and the lowest 0 in 2003. The trend for injuries per 1,000 fire incidents is constant. Compared to the state value the number of casualties per 1,000 incidents is higher.Casualties per 1,000 incidents in Laconia, NH compared to nearest cities:
(Note: Based on data for all years, including only cities with at least 500 fire incidents)
| Laconia: | 17.4 |
| Gilford: | 3.8 |
| Belmont: | 39.7 |
| Sanbornton: | 28.6 |
| Meredith: | 4.6 |
| Tilton: | 5.3 |
| Northfield: | 20.7 |
| Franklin: | 37.9 |
| Alton: | 1.5 |
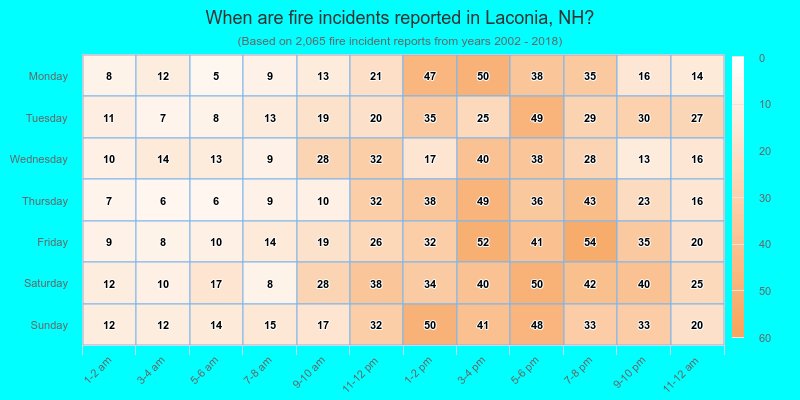
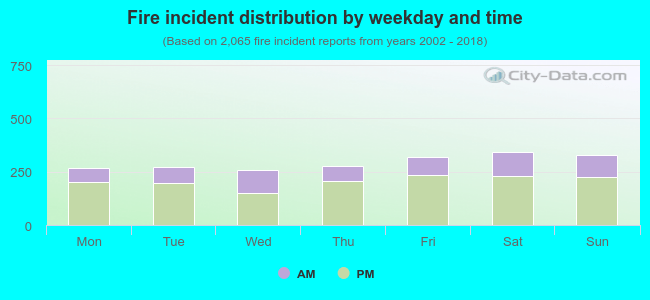 30.2% incidents where reported in the morning and 69.8% in the evening. The most fires (16.7%) took place on Saturday, and the least (12.5%) on Wednesday.
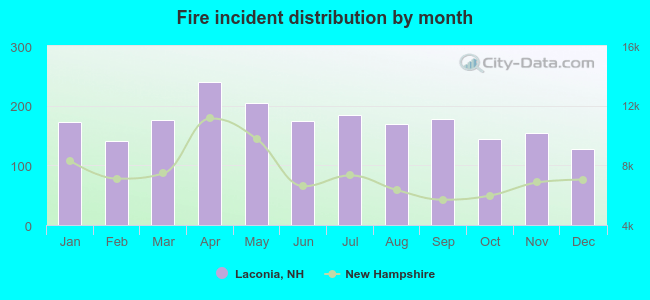 According to the 2,065 fires from years 2002 - 2018 most fires (11.6%) took place during April, and the least (6.2%) in December.
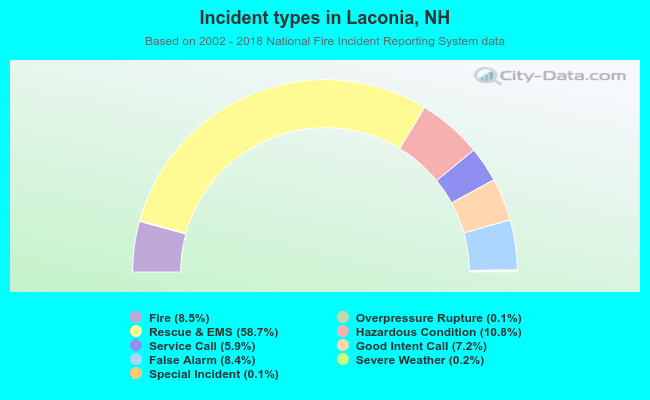 Out of all 24,266 cases reported during the years 2002 - 2018, the most belonged to the categories: Rescue & EMS (58.7%), Hazardous Condition (10.8%), and Fire (8.5%).
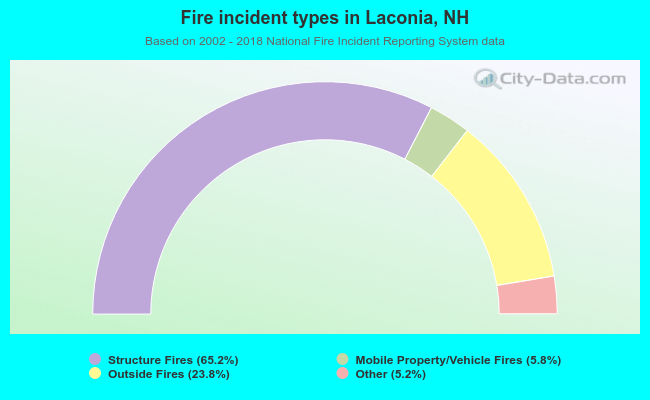 When looking into fire subcategories, the most incidents belonged to: Structure Fires (65.2%), and Outside Fires (23.8%).