Pembroke: Fire Incidents, New Hampshire (NH)
Where are fire incidents reported in Pembroke, NH
Something went wrong! Please refresh the page.
|
| |||||||||||||||||||||||||||||||||||||||||||||||||||||||||||||||||||||||||||||||||||||||||||||||||||||||||||||
2002 - 2018 National Fire Incident Reporting System (NFIRS) incidents
- Incident types reported to NFIRS in Pembroke, NH
- 71424.9%Rescue & EMS
- 68223.7%Hazardous Condition
- 44515.5%Fire
- 41014.3%False Alarm
- 36712.8%Good Intent Call
- 2207.7%Service Call
- 180.6%Severe Weather
- 120.4%Special Incident
- 40.1%Overpressure Rupture
- Fire incident types reported to NFIRS in Pembroke, NH
- 27461.6%Structure Fires
- 10022.5%Outside Fires
- 5612.6%Mobile Property/Vehicle Fires
- 153.4%Other
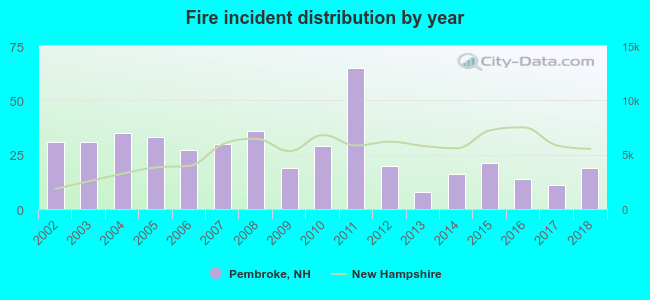 Based on the data from the years 2002 - 2018 the average number of fires per year is 26. The highest number of reported fires - 65 took place in 2011, and the least - 8 in 2013. The data has a decreasing trend.
The average number of yearly fire incidents per 10k residents in Pembroke, NH compared to nearest cities:
(Note: Based on data for the last 3 years, including only cities with population 5,000 and above)
| Pembroke: | 20.6 |
| Bow: | 72.7 |
| Concord: | 41.9 |
| Loudon: | 96.5 |
| Goffstown: | 31.5 |
| Manchester: | 27.2 |
| Hopkinton: | 66.8 |
| Weare: | 58.1 |
| Bedford: | 24.5 |
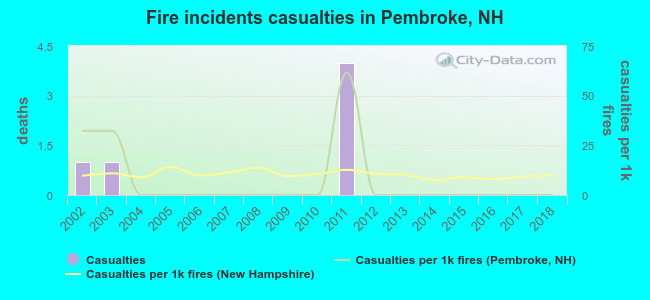 According to the data from the years 2002 - 2018 the average number of fire-related casualties per year is 0. The highest number of reported injuries - 4 took place in 2011, and the lowest - 0 in 2004. The data has a declining trend.
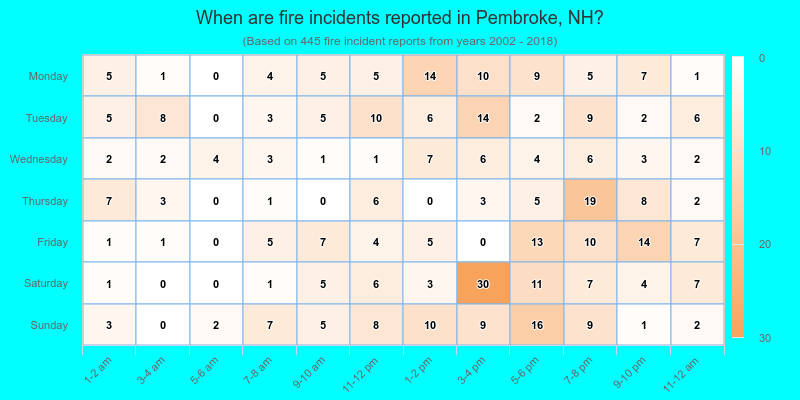
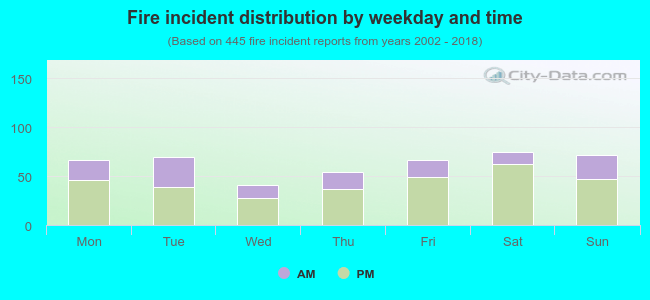 30.8% incidents where reported in the morning and 69.2% in the evening. The most fires (16.9%) took place on Saturday, and the least (9.2%) on Wednesday.
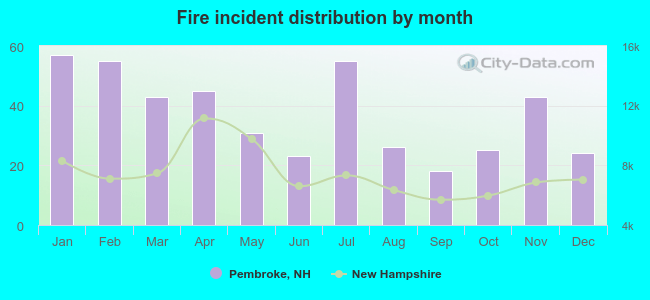 According to the 445 fire incident reports from years 2002 - 2018 most fires (12.8%) took place during January, and the least (4.0%) in September.
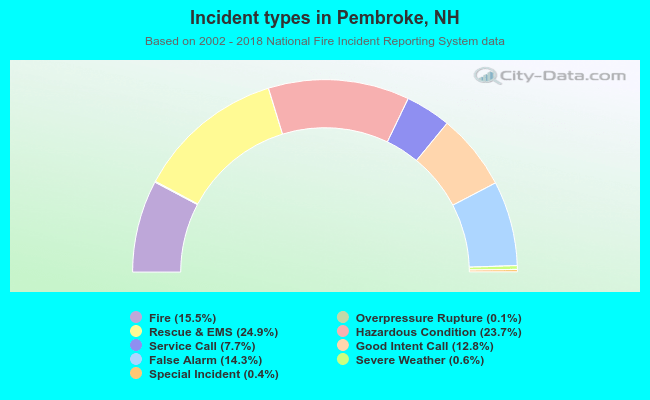 Out of all 2,872 cases reported during the years 2002 - 2018, the most belonged to the categories: Rescue & EMS (24.9%), Hazardous Condition (23.7%), and Fire (15.5%).
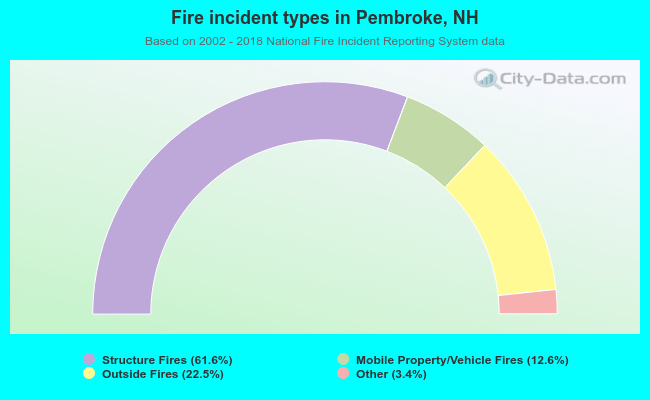 When looking into fire subcategories, the most incidents belonged to: Structure Fires (61.6%), and Outside Fires (22.5%).