Knoxville: Fire Incidents, Tennessee (TN)
Where are fire incidents reported in Knoxville, TN
Something went wrong! Please refresh the page.
| Fire incidents reported | |
|---|---|
| Sreet name | Count |
| KINGSTON PKE | 974 |
| BROADWAY | 956 |
| CHAPMAN HWY | 672 |
| CLINTON HWY | 604 |
| WESTERN AV | 526 |
| MAGNOLIA AV | 454 |
| ASHEVILLE HWY | 394 |
| LINDEN AV | 332 |
| AILOR AV | 316 |
| TOWN VIEW DR | 316 |
| MIDDLEBROOK PKE | 306 |
| OLDHAM AV | 252 |
| ISABELLA CIR | 248 |
| NORTHSHORE DR | 246 |
| PETERS RD | 236 |
| ALCOA HWY | 234 |
| CUMBERLAND AV | 234 |
| CENTRAL ST | 220 |
| EMORY RD | 220 |
| OLIVE ST | 220 |
| DAYLILY DR | 218 |
| HIGHLAND AV | 216 |
| OAK RIDGE HWY | 196 |
| VIRGINIA AV | 194 |
| CEDAR LN | 192 |
| GLEASON DR | 190 |
| KINGSTON PIKE | 190 |
| PLEASANT RIDGE RD | 188 |
| PARKSIDE DR | 186 |
| SUTHERLAND AV | 186 |
| Other | 17,642 |
2002 - 2018 National Fire Incident Reporting System (NFIRS) incidents
- Incident types reported to NFIRS in Knoxville, TN
- 111,68245.5%Rescue & EMS
- 51,49521.0%Good Intent Call
- 27,55811.2%Fire
- 21,9128.9%Service Call
- 21,2868.7%False Alarm
- 10,7994.4%Hazardous Condition
- 3210.1%Overpressure Rupture
- 2760.1%Special Incident
- Fire incident types reported to NFIRS in Knoxville, TN
- 13,03547.3%Outside Fires
- 8,76931.8%Structure Fires
- 5,11818.6%Mobile Property/Vehicle Fires
- 6362.3%Other
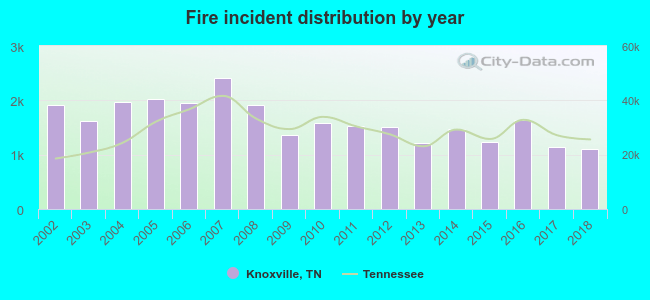 According to the data from the years 2002 - 2018 the average number of fire incidents per year is 1,621. The highest number of fire incidents - 2,410 took place in 2007, and the least - 1,103 in 2018. The data has a dropping trend.
The average number of yearly fire incidents per 10k residents in Knoxville, TN compared to nearest cities:
(Note: Based on data for the last 3 years, including only cities with population 5,000 and above)
| Knoxville: | 70.0 |
| Powell: | 21.2 |
| Seymour: | 67.2 |
| Alcoa: | 64.4 |
| Clinton: | 105.5 |
| Maryville: | 76.7 |
| Strawberry Plains: | 29.7 |
| Oak Ridge: | 29.8 |
| Sevierville: | 183.4 |
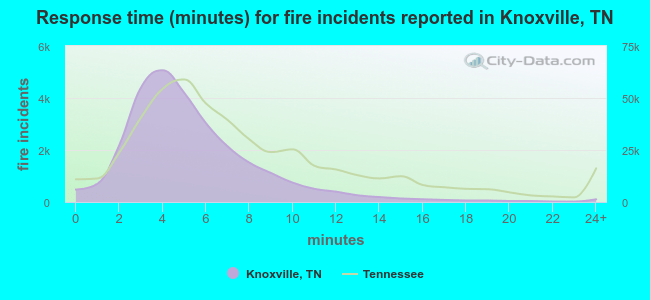 The median response time based on all reported fire incidents is 5 minutes. This is lower compared to the state median value.
The median response time in Knoxville, TN compared to nearest cities:
(Note: Based on data for all years, including only cities with at least 500 fire incidents)
| Knoxville: | 5 minutes |
| Powell: | 8 minutes |
| Seymour: | 8 minutes |
| Alcoa: | 4 minutes |
| Clinton: | 5 minutes |
| Maryville: | 6 minutes |
| Andersonville: | 11 minutes |
| Oak Ridge: | 4 minutes |
| Maynardville: | 10 minutes |
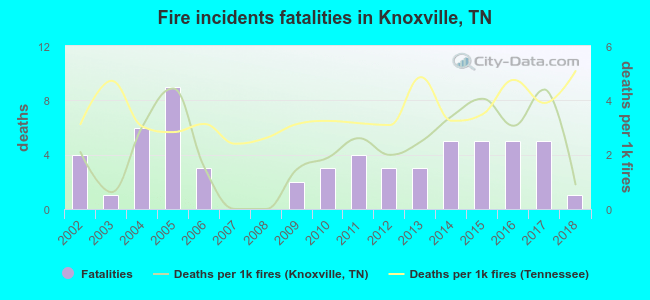 Based on the data from the years 2002 - 2018 the average number of fire-related fatalities per year is 3. The highest number of deaths - 9 took place in 2005, and the lowest - 0 in 2007. The data has a decreasing trend.
The average number of fatalities per 1,000 fires is 2. This indicator was the highest - 4 in 2005, and the lowest 0 in 2007. The trend for deaths per 1,000 incidents is declining. Compared to the state value the number of deaths per 1,000 fire incidents is lower.
Based on the data from the years 2002 - 2018 the average number of fire-related fatalities per year is 3. The highest number of deaths - 9 took place in 2005, and the lowest - 0 in 2007. The data has a decreasing trend.
The average number of fatalities per 1,000 fires is 2. This indicator was the highest - 4 in 2005, and the lowest 0 in 2007. The trend for deaths per 1,000 incidents is declining. Compared to the state value the number of deaths per 1,000 fire incidents is lower.Deaths per 1,000 incidents in Knoxville, TN compared to nearest cities:
(Note: Based on data for all years, including only cities with at least 2,500 fire incidents)
| Knoxville: | 2.1 |
| Maryville: | 2.8 |
| Sevierville: | 2.7 |
| Gatlinburg: | 5.2 |
| Harriman: | 2.8 |
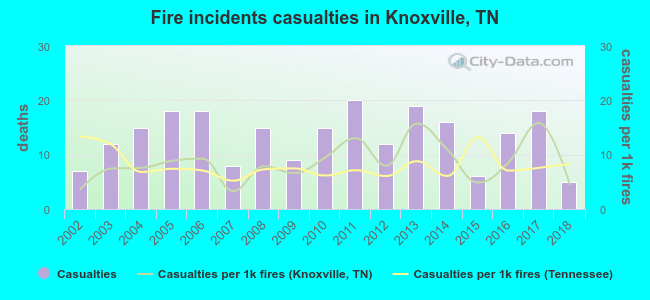 Based on the reports from the years 2002 - 2018 the average number of fire-related casualties per year is 13. The highest number of reported casualties - 20 took place in 2011, and the lowest - 5 in 2018. The data has a declining trend.
The average number of casualties per 1,000 fire incidents is 9. This indicator was the highest - 16 in 2017, and the lowest 3 in 2007. The trend for casualties per 1,000 incidents is increasing. Compared to the state value the number of injuries per 1,000 fire incidents is similar.
Based on the reports from the years 2002 - 2018 the average number of fire-related casualties per year is 13. The highest number of reported casualties - 20 took place in 2011, and the lowest - 5 in 2018. The data has a declining trend.
The average number of casualties per 1,000 fire incidents is 9. This indicator was the highest - 16 in 2017, and the lowest 3 in 2007. The trend for casualties per 1,000 incidents is increasing. Compared to the state value the number of injuries per 1,000 fire incidents is similar.Casualties per 1,000 incidents in Knoxville, TN compared to nearest cities:
(Note: Based on data for all years, including only cities with at least 500 fire incidents)
| Knoxville: | 8.2 |
| Powell: | 12.5 |
| Seymour: | 10.4 |
| Alcoa: | 3.9 |
| Clinton: | 5.0 |
| Maryville: | 56.1 |
| Andersonville: | 3.7 |
| Oak Ridge: | 16.4 |
| Maynardville: | 0.5 |
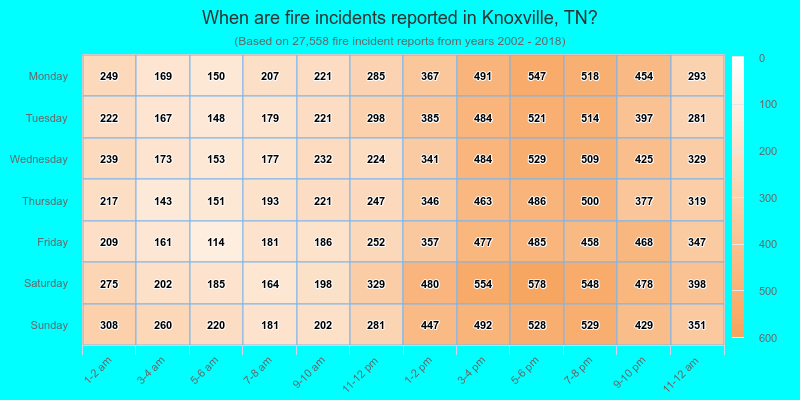
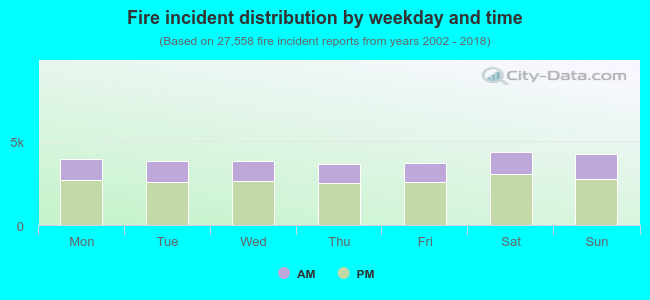 31.9% incidents where reported in the morning and 68.1% in the evening. The most fires (15.9%) took place on Saturday, and the least (13.3%) on Thursday.
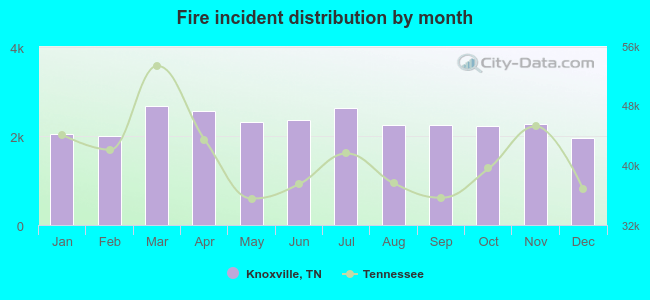 According to the 27,558 fire incident reports from years 2002 - 2018 most fires (9.7%) took place during March, and the least (7.1%) in December.
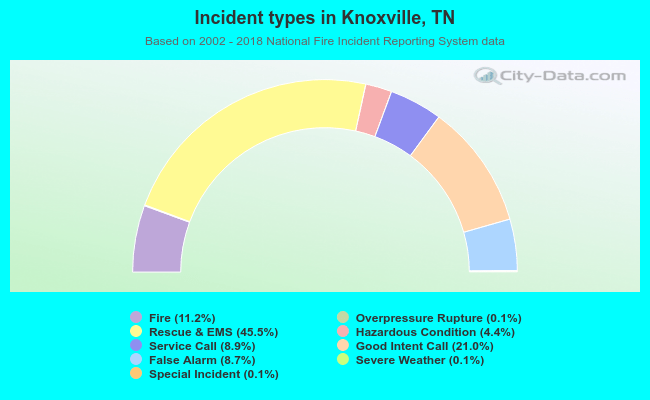 Out of all 245,497 cases reported during the years 2002 - 2018, the most belonged to the categories: Rescue & EMS (45.5%), Good Intent Call (21.0%), and Fire (11.2%).
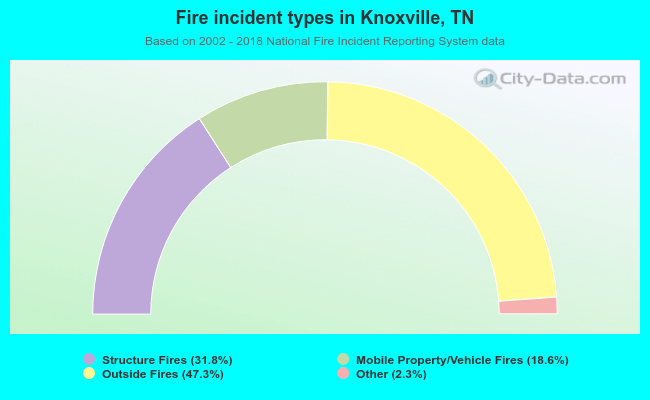 When looking into fire subcategories, the most reports belonged to: Outside Fires (47.3%), and Structure Fires (31.8%).