Alcoa: Fire Incidents, Tennessee (TN)
Where are fire incidents reported in Alcoa, TN
Something went wrong! Please refresh the page.
| Fire incidents reported | |
|---|---|
| Sreet name | Count |
| HALL RD | 270 |
| AIRPORT HWY | 198 |
| WRIGHT RD | 130 |
| ALCOA HWY | 90 |
| LOUISVILLE RD | 76 |
| CALDERWOOD ST | 74 |
| HUNT RD | 64 |
| HUNTERS CROSSING DR | 58 |
| HAMILTON CROSSING DR | 48 |
| MCARTHUR RD | 48 |
| PELLISSIPPI PKY | 42 |
| CUSICK RD | 40 |
| WATT ST | 30 |
| 129 HWY | 28 |
| DALTON ST | 28 |
| LINCOLN RD | 28 |
| TOPSIDE RD | 28 |
| OLD KNOXVILLE HWY | 24 |
| GILL ST | 22 |
| BESSEMER ST | 20 |
| EDISON ST | 20 |
| FOUNTAIN VIEW CIR | 20 |
| LINDSAY ST | 20 |
| ASSOCIATES BLVD | 18 |
| GRAYSON DR | 18 |
| HOWE ST | 16 |
| JOULE ST | 16 |
| SPRINGBROOK RD | 16 |
| MIDDLESETTLEMENTS RD | 14 |
| NEWCOMEN ST | 14 |
2002 - 2018 National Fire Incident Reporting System (NFIRS) incidents
- Incident types reported to NFIRS in Alcoa, TN
- 6,18561.1%Rescue & EMS
- 1,03610.2%Fire
- 8838.7%Hazardous Condition
- 8728.6%Service Call
- 5465.4%Good Intent Call
- 5395.3%False Alarm
- 340.3%Overpressure Rupture
- 130.1%Special Incident
- Fire incident types reported to NFIRS in Alcoa, TN
- 44442.9%Outside Fires
- 27826.8%Structure Fires
- 25624.7%Mobile Property/Vehicle Fires
- 585.6%Other
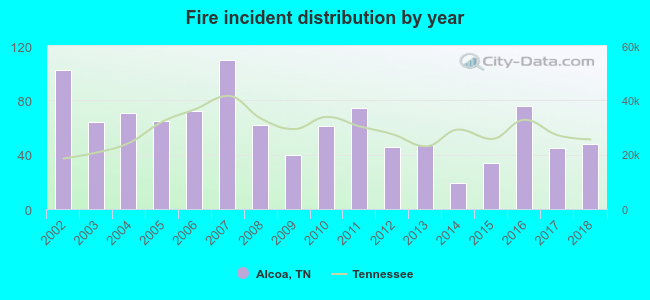 Based on the data from the years 2002 - 2018 the average number of fire incidents per year is 61. The highest number of reported fires - 110 took place in 2007, and the least - 19 in 2014. The data has a declining trend.
The average number of yearly fire incidents per 10k residents in Alcoa, TN compared to nearest cities:
(Note: Based on data for the last 3 years, including only cities with population 5,000 and above)
| Alcoa: | 64.4 |
| Maryville: | 76.7 |
| Knoxville: | 70.0 |
| Seymour: | 67.2 |
| Lenoir City: | 111.8 |
| Powell: | 21.2 |
| Loudon: | 166.2 |
| Oak Ridge: | 29.8 |
| Clinton: | 105.5 |
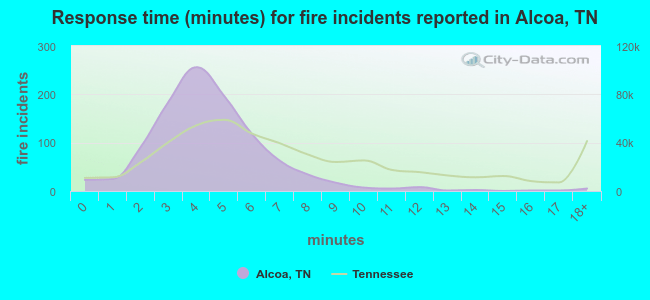 The median response time based on all reported fire incidents is 4 minutes. This is lower compared to the state median value.
The median response time in Alcoa, TN compared to nearest cities:
(Note: Based on data for all years, including only cities with at least 500 fire incidents)
| Alcoa: | 4 minutes |
| Maryville: | 6 minutes |
| Knoxville: | 5 minutes |
| Seymour: | 8 minutes |
| Lenoir City: | 6 minutes |
| Powell: | 8 minutes |
| Vonore: | 7 minutes |
| Loudon: | 7 minutes |
| Oak Ridge: | 4 minutes |
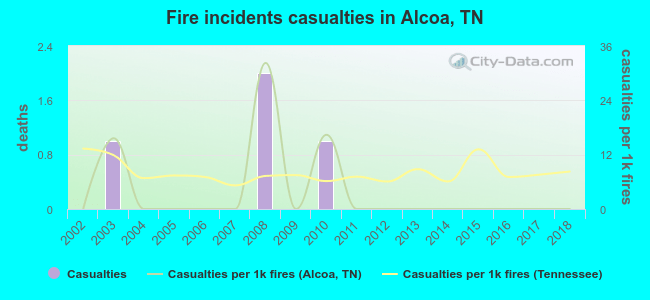 According to the reports from the years 2002 - 2018 the average number of fire-related casualties per year is 0. The highest number of reported casualties - 2 took place in 2008, and the lowest - 0 in 2002. The data has a constant trend.
The average number of injuries per 1,000 fire incidents is 4. This indicator was the highest - 32 in 2008, and the lowest 0 in 2002. The trend for injuries per 1,000 fire incidents is constant. Compared to the state value the number of casualties per 1,000 fire incidents is much lower.
According to the reports from the years 2002 - 2018 the average number of fire-related casualties per year is 0. The highest number of reported casualties - 2 took place in 2008, and the lowest - 0 in 2002. The data has a constant trend.
The average number of injuries per 1,000 fire incidents is 4. This indicator was the highest - 32 in 2008, and the lowest 0 in 2002. The trend for injuries per 1,000 fire incidents is constant. Compared to the state value the number of casualties per 1,000 fire incidents is much lower.
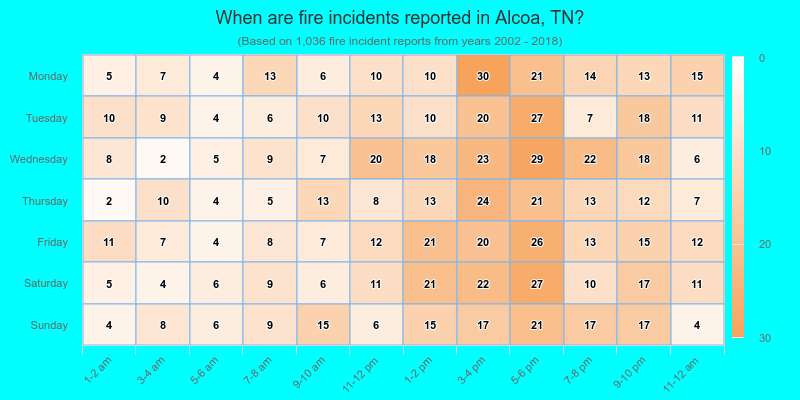
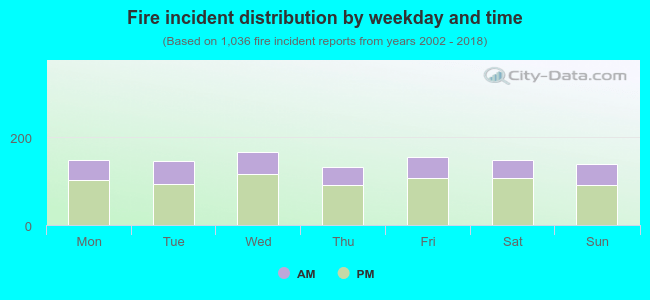 31.7% incidents where reported in the morning and 68.3% in the evening. The most fires (16.1%) took place on Wednesday, and the least (12.7%) on Thursday.
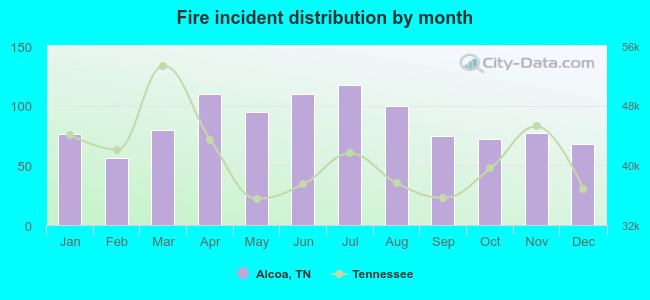 According to the 1,036 incident reports from years 2002 - 2018 most fires (11.3%) took place during July, and the least (5.4%) in February.
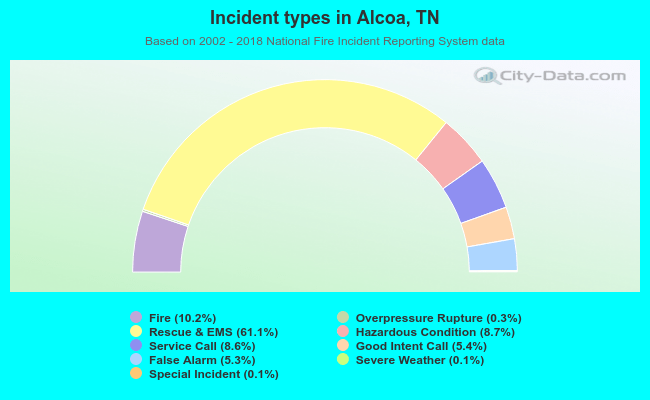 Out of all 10,116 cases reported during the years 2002 - 2018, the most belonged to the categories: Rescue & EMS (61.1%), Fire (10.2%), and Hazardous Condition (8.7%).
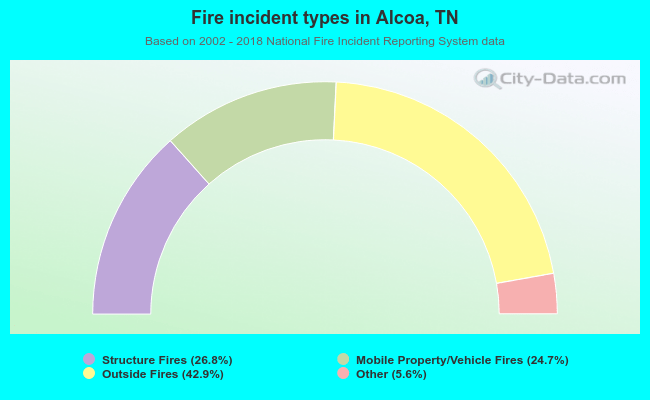 When looking into fire subcategories, the most incidents belonged to: Outside Fires (42.9%), and Structure Fires (26.8%).