Klamath Falls: Fire Incidents, Oregon (OR)
Where are fire incidents reported in Klamath Falls, OR
Something went wrong! Please refresh the page.
| Fire incidents reported | |
|---|---|
| Sreet name | Count |
| MAIN ST | 168 |
| 6TH ST | 162 |
| WASHBURN WAY | 148 |
| SUMMERS LN | 120 |
| SHASTA WAY | 84 |
| 97 HWY | 82 |
| HOMEDALE RD | 76 |
| 6 ST | 72 |
| OLD FORT RD | 72 |
| ALTAMONT DR | 68 |
| HWY 97 | 62 |
| HILYARD AVE | 56 |
| EBERLEIN AVE | 52 |
| TINGLEY LN | 50 |
| BISBEE ST | 48 |
| HILL RD | 46 |
| AVALON ST | 42 |
| WIARD ST | 42 |
| HOPE ST | 40 |
| MARTIN ST | 40 |
| POE VALLEY RD | 40 |
| BRISTOL AVE | 38 |
| SPRING ST | 36 |
| WOCUS RD | 36 |
| ELDORADO AVE | 34 |
| LAKEPORT BLVD | 34 |
| REEDER RD | 34 |
| OLD MIDLAND RD | 32 |
| CREST ST | 30 |
| LAVERNE AVE | 30 |
| Other | 732 |
2002 - 2018 National Fire Incident Reporting System (NFIRS) incidents
- Incident types reported to NFIRS in Klamath Falls, OR
- 11,22161.7%Rescue & EMS
- 2,60614.3%Fire
- 2,16711.9%Service Call
- 1,1526.3%Good Intent Call
- 6253.4%Hazardous Condition
- 3852.1%False Alarm
- Fire incident types reported to NFIRS in Klamath Falls, OR
- 1,10842.5%Outside Fires
- 1,05540.5%Structure Fires
- 40115.4%Mobile Property/Vehicle Fires
- 421.6%Other
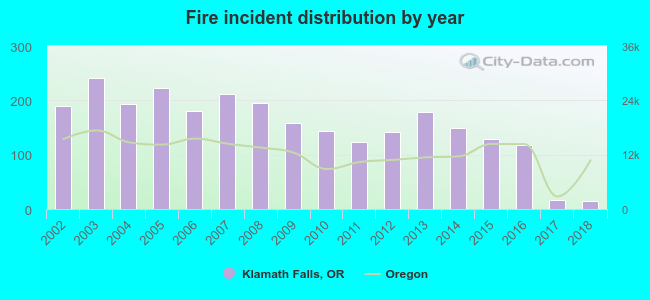 According to the data from the years 2002 - 2018 the average number of fires per year is 153. The highest number of reported fire incidents - 241 took place in 2003, and the least - 14 in 2018. The data has a declining trend.
The average number of yearly fire incidents per 10k residents in Klamath Falls, OR compared to nearest cities:
(Note: Based on data for the last 3 years, including only cities with population 5,000 and above)
| Klamath Falls: | 23.4 |
| Ashland: | 26.6 |
| Talent: | 27.4 |
| Eagle Point: | 24.4 |
| White City: | 25.9 |
| Medford: | 17.4 |
| Central Point: | 29.9 |
| Grants Pass: | 44.5 |
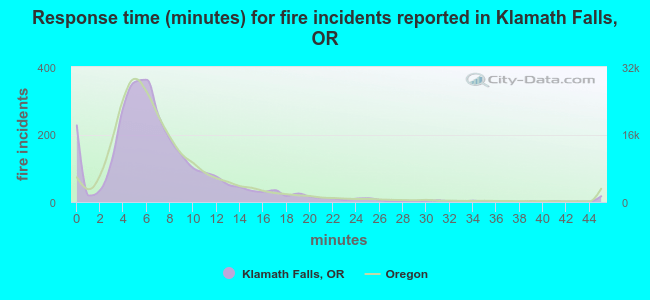 The median response time based on all reported fire incidents is 6 minutes. This is close to the state median value.
The median response time in Klamath Falls, OR compared to nearest cities:
(Note: Based on data for all years, including only cities with at least 500 fire incidents)
| Klamath Falls: | 6 minutes |
| Ashland: | 6 minutes |
| Eagle Point: | 9 minutes |
| White City: | 6 minutes |
| Medford: | 5 minutes |
| Central Point: | 8 minutes |
| Jacksonville: | 10 minutes |
| Weed: | 7 minutes |
| Grants Pass: | 7 minutes |
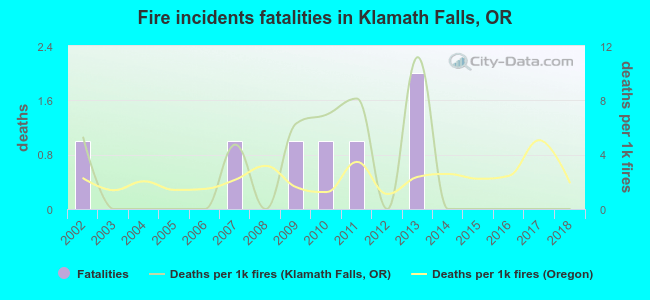 According to the reports from the years 2002 - 2018 the average number of fire-related yearly deaths is 0. The highest number of deaths - 2 took place in 2013, and the lowest - 0 in 2003. The data has a declining trend.
The average number of fatalities per 1,000 fire incidents is 3. This indicator was the highest - 11 in 2013, and the lowest 0 in 2003. The trend for fatalities per 1,000 fire incidents is dropping. Compared to the Oregon value the number of deaths per 1,000 incidents is higher.
According to the reports from the years 2002 - 2018 the average number of fire-related yearly deaths is 0. The highest number of deaths - 2 took place in 2013, and the lowest - 0 in 2003. The data has a declining trend.
The average number of fatalities per 1,000 fire incidents is 3. This indicator was the highest - 11 in 2013, and the lowest 0 in 2003. The trend for fatalities per 1,000 fire incidents is dropping. Compared to the Oregon value the number of deaths per 1,000 incidents is higher.Deaths per 1,000 incidents in Klamath Falls, OR compared to nearest cities:
(Note: Based on data for all years, including only cities with at least 2,500 fire incidents)
| Klamath Falls: | 2.7 |
| Medford: | 2.4 |
| Grants Pass: | 2.1 |
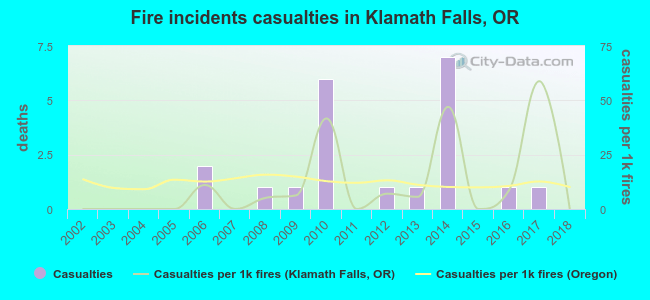 According to the data from the years 2002 - 2018 the average number of fire-related yearly casualties is 1. The highest number of casualties - 7 took place in 2014, and the lowest - 0 in 2002. The data has a constant trend.
The average number of casualties per 1,000 fire incidents is 11. This indicator was the highest - 59 in 2017, and the lowest 0 in 2002. The trend for casualties per 1,000 fires is constant. Compared to the Oregon value the number of injuries per 1,000 incidents is lower.
According to the data from the years 2002 - 2018 the average number of fire-related yearly casualties is 1. The highest number of casualties - 7 took place in 2014, and the lowest - 0 in 2002. The data has a constant trend.
The average number of casualties per 1,000 fire incidents is 11. This indicator was the highest - 59 in 2017, and the lowest 0 in 2002. The trend for casualties per 1,000 fires is constant. Compared to the Oregon value the number of injuries per 1,000 incidents is lower.Casualties per 1,000 incidents in Klamath Falls, OR compared to nearest cities:
(Note: Based on data for all years, including only cities with at least 500 fire incidents)
| Klamath Falls: | 8.1 |
| Ashland: | 7.5 |
| Eagle Point: | 10.4 |
| White City: | 11.8 |
| Medford: | 9.8 |
| Central Point: | 19.6 |
| Jacksonville: | 9.2 |
| Weed: | 6.4 |
| Grants Pass: | 14.4 |
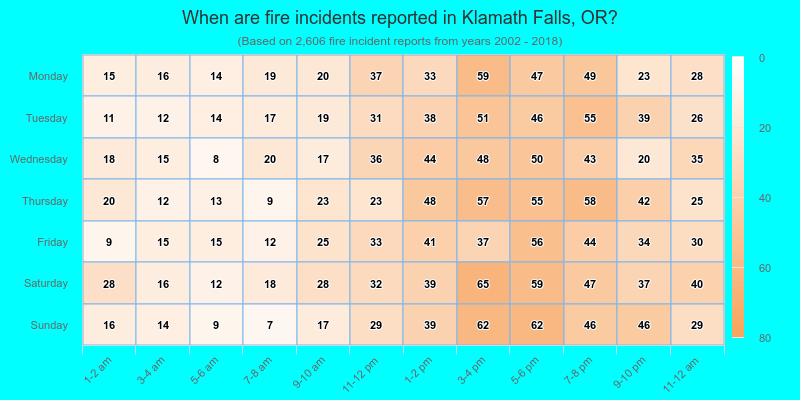
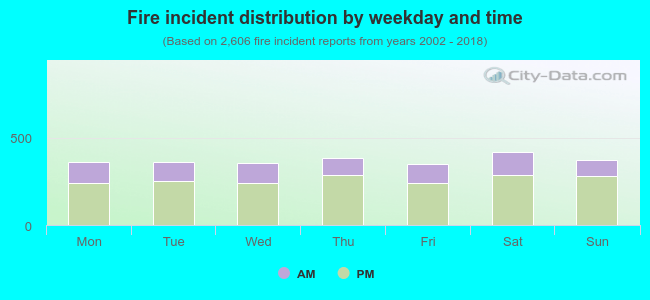 29.7% incidents where reported in the morning and 70.3% in the evening. The most fires (16.2%) took place on Saturday, and the least (13.5%) on Friday.
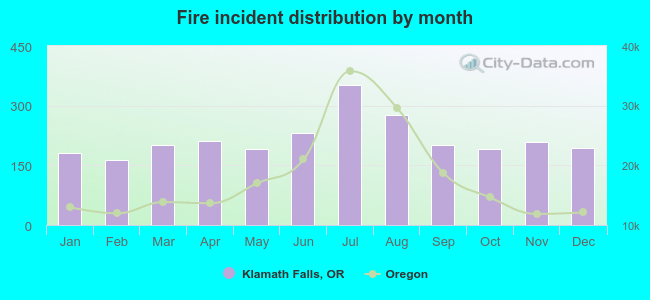 Based on the 2,606 fires from years 2002 - 2018 most fires (13.5%) took place during July, and the least (6.3%) in February.
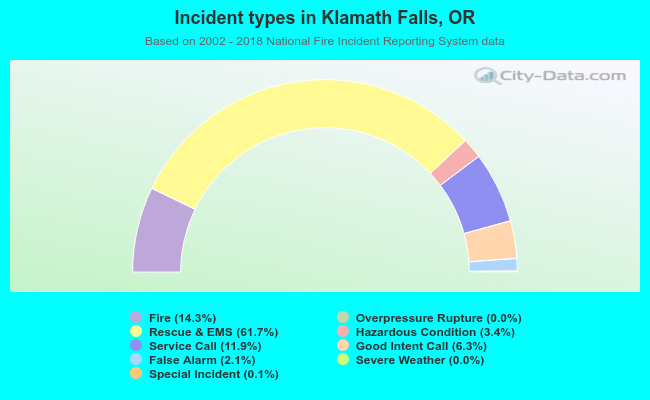 Out of all 18,187 cases reported during the years 2002 - 2018, the most belonged to the categories: Rescue & EMS (61.7%), Fire (14.3%), and Service Call (11.9%).
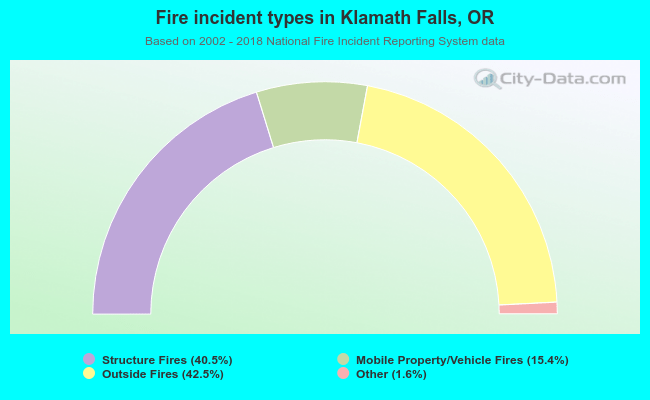 When looking into fire subcategories, the most incidents belonged to: Outside Fires (42.5%), and Structure Fires (40.5%).