Grants Pass: Fire Incidents, Oregon (OR)
Where are fire incidents reported in Grants Pass, OR
Something went wrong! Please refresh the page.
| Fire incidents reported | |
|---|---|
| Sreet name | Count |
| ROGUE RIVER HWY | 302 |
| 6TH ST | 254 |
| WILLIAMS HWY | 252 |
| REDWOOD HWY | 232 |
| REDWOOD AVE | 184 |
| MONUMENT DR | 128 |
| LOWER RIVER RD | 122 |
| CLOVERLAWN DR | 120 |
| 7TH ST | 118 |
| FOOTHILL BLVD | 118 |
| F ST | 108 |
| INTERSTATE 5 FWY | 108 |
| BEACON DR | 102 |
| D ST | 102 |
| LEONARD RD | 100 |
| M ST | 100 |
| MERLIN RD | 100 |
| NEW HOPE RD | 100 |
| AGNESS AVE | 98 |
| HIGHLAND AVE | 94 |
| APPLEGATE RD | 90 |
| G ST | 90 |
| TERRY LN | 90 |
| E ST | 76 |
| FRUITDALE DR | 70 |
| UPPER RIVER RD | 70 |
| ALLEN CREEK RD | 64 |
| RIVERBANKS RD | 56 |
| N ST | 54 |
| DEMARAY DR | 52 |
| Other | 1,599 |
2002 - 2018 National Fire Incident Reporting System (NFIRS) incidents
- Incident types reported to NFIRS in Grants Pass, OR
- 8,41333.1%Rescue & EMS
- 5,58922.0%Good Intent Call
- 5,15320.3%Fire
- 3,12112.3%Service Call
- 2,2138.7%Hazardous Condition
- 8513.3%False Alarm
- 300.1%Special Incident
- 260.1%Severe Weather
- Fire incident types reported to NFIRS in Grants Pass, OR
- 2,16742.1%Outside Fires
- 2,01039.0%Structure Fires
- 88717.2%Mobile Property/Vehicle Fires
- 891.7%Other
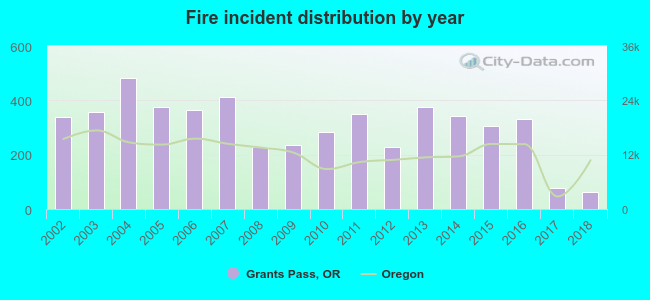 According to the data from the years 2002 - 2018 the average number of fire incidents per year is 303. The highest number of reported fire incidents - 483 took place in 2004, and the least - 64 in 2018. The data has a declining trend.
The average number of yearly fire incidents per 10k residents in Grants Pass, OR compared to nearest cities:
(Note: Based on data for the last 3 years, including only cities with population 5,000 and above)
| Grants Pass: | 44.5 |
| Central Point: | 29.9 |
| Medford: | 17.4 |
| White City: | 25.9 |
| Eagle Point: | 24.4 |
| Talent: | 27.4 |
| Ashland: | 26.6 |
| Tenmile: | 2.1 |
| Winston: | 29.3 |
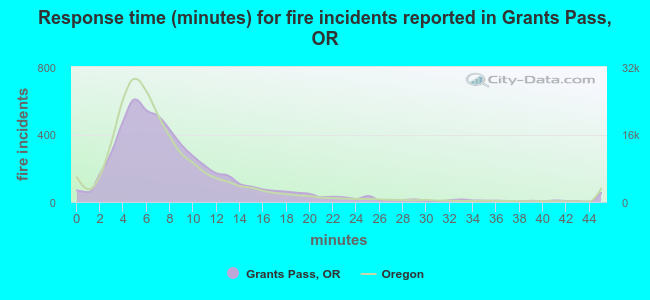 The median response time based on all reported fire incidents is 7 minutes. This is about the same as the state median value.
The median response time in Grants Pass, OR compared to nearest cities:
(Note: Based on data for all years, including only cities with at least 500 fire incidents)
| Grants Pass: | 7 minutes |
| Jacksonville: | 10 minutes |
| Central Point: | 8 minutes |
| Cave Junction: | 8 minutes |
| Medford: | 5 minutes |
| White City: | 6 minutes |
| Eagle Point: | 9 minutes |
| Ashland: | 6 minutes |
| Myrtle Creek: | 7 minutes |
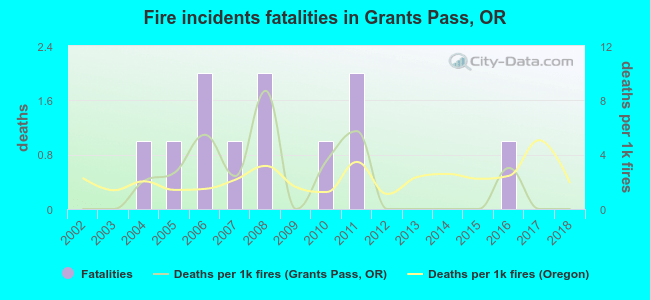 According to the data from the years 2002 - 2018 the average number of fire-related fatalities per year is 1. The highest number of deaths - 2 took place in 2006, and the lowest - 0 in 2002. The data has a constant trend.
The average number of deaths per 1,000 fire incidents is 2. This indicator was the highest - 9 in 2008, and the lowest 0 in 2002. The trend for deaths per 1,000 incidents is constant. Compared to the Oregon value the number of fatalities per 1,000 fires is similar.
According to the data from the years 2002 - 2018 the average number of fire-related fatalities per year is 1. The highest number of deaths - 2 took place in 2006, and the lowest - 0 in 2002. The data has a constant trend.
The average number of deaths per 1,000 fire incidents is 2. This indicator was the highest - 9 in 2008, and the lowest 0 in 2002. The trend for deaths per 1,000 incidents is constant. Compared to the Oregon value the number of fatalities per 1,000 fires is similar.
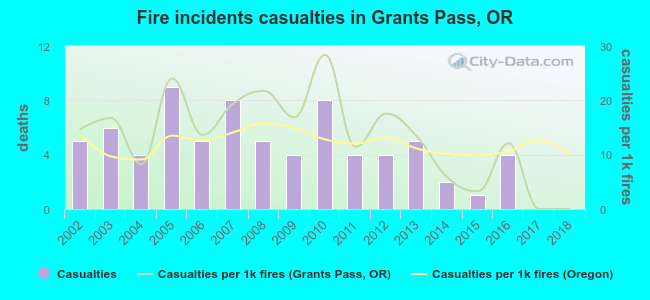 Based on the data from the years 2002 - 2018 the average number of fire-related yearly casualties is 4. The highest number of reported injuries - 9 took place in 2005, and the lowest - 0 in 2017. The data has a dropping trend.
The average number of casualties per 1,000 fire incidents is 13. This indicator was the highest - 28 in 2010, and the lowest 0 in 2017. The trend for casualties per 1,000 fire incidents is declining. Compared to the state value the number of injuries per 1,000 fires is about the same.
Based on the data from the years 2002 - 2018 the average number of fire-related yearly casualties is 4. The highest number of reported injuries - 9 took place in 2005, and the lowest - 0 in 2017. The data has a dropping trend.
The average number of casualties per 1,000 fire incidents is 13. This indicator was the highest - 28 in 2010, and the lowest 0 in 2017. The trend for casualties per 1,000 fire incidents is declining. Compared to the state value the number of injuries per 1,000 fires is about the same.Casualties per 1,000 incidents in Grants Pass, OR compared to nearest cities:
(Note: Based on data for all years, including only cities with at least 500 fire incidents)
| Grants Pass: | 14.4 |
| Jacksonville: | 9.2 |
| Central Point: | 19.6 |
| Cave Junction: | 4.9 |
| Medford: | 9.8 |
| White City: | 11.8 |
| Eagle Point: | 10.4 |
| Ashland: | 7.5 |
| Myrtle Creek: | 4.1 |
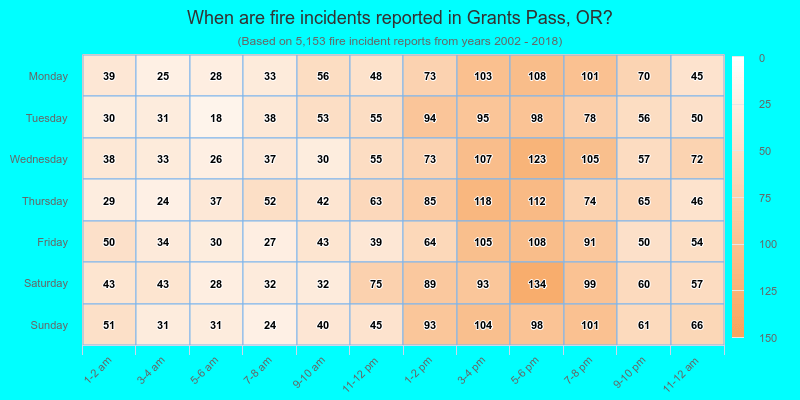
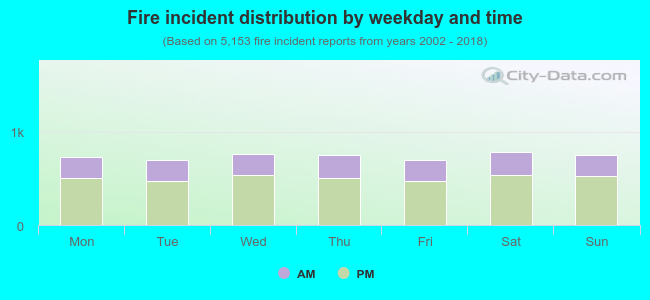 31.4% incidents where reported in the morning and 68.6% in the evening. The most fires (15.2%) took place on Saturday, and the least (13.5%) on Friday.
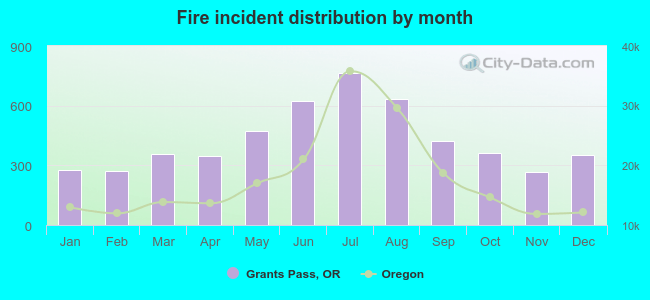 Based on the 5,153 fire incident reports from years 2002 - 2018 most fires (14.8%) took place during July, and the least (5.2%) in November.
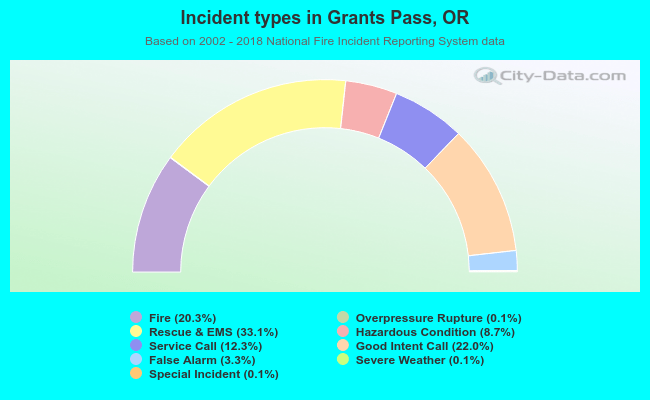 Out of all 25,420 cases reported during the years 2002 - 2018, the most belonged to the categories: Rescue & EMS (33.1%), Good Intent Call (22.0%), and Fire (20.3%).
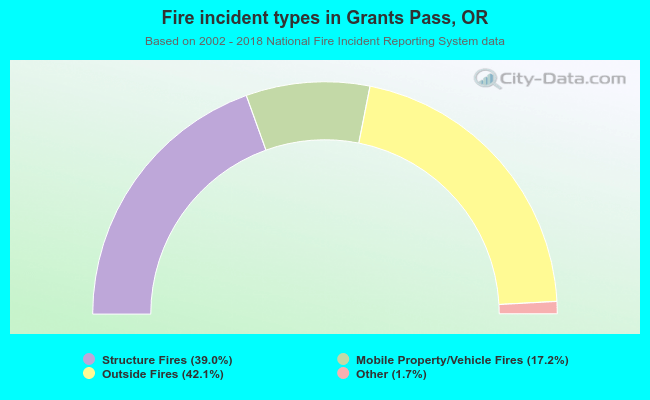 When looking into fire subcategories, the most incidents belonged to: Outside Fires (42.1%), and Structure Fires (39.0%).