Killeen: Fire Incidents, Texas (TX)
Where are fire incidents reported in Killeen, TX
Something went wrong! Please refresh the page.
| Fire incidents reported | |
|---|---|
| Sreet name | Count |
| CENTRAL TEXAS EXPY | 524 |
| RANCIER AVE | 282 |
| FT HOOD ST | 214 |
| CLEAR CREEK RD | 212 |
| TRIMMIER RD | 178 |
| LAKE RD | 146 |
| WS YOUNG DR | 138 |
| VETERANS MEMORIAL BLVD | 134 |
| FORT HOOD ST | 128 |
| ELMS RD | 118 |
| W S YOUNG DR | 116 |
| F M 439 | 112 |
| STAN SCHLUETER LOOP | 108 |
| 38TH ST | 104 |
| BACON RANCH RD | 104 |
| BUS 190 | 104 |
| HALLMARK AVE | 100 |
| TWIN CREEK DR | 100 |
| WILLOW SPRINGS RD | 96 |
| TERRACE DR | 92 |
| STAN SCHLUETER LP | 90 |
| 8TH ST | 86 |
| CANTABRIAN DR | 86 |
| GILMER ST | 84 |
| GRAY ST | 84 |
| BUNDRANT DR | 82 |
| ZEPHYR RD | 82 |
| COLLEGE ST | 80 |
| 2ND ST | 76 |
| CONDER ST | 72 |
| Other | 3,686 |
2002 - 2018 National Fire Incident Reporting System (NFIRS) incidents
- Incident types reported to NFIRS in Killeen, TX
- 44,98262.6%Rescue & EMS
- 9,19612.8%Good Intent Call
- 7,61810.6%Fire
- 5,5477.7%Hazardous Condition
- 3,0744.3%False Alarm
- 1,2031.7%Service Call
- 1110.2%Special Incident
- Fire incident types reported to NFIRS in Killeen, TX
- 3,42244.9%Structure Fires
- 2,75436.2%Outside Fires
- 1,17015.4%Mobile Property/Vehicle Fires
- 2723.6%Other
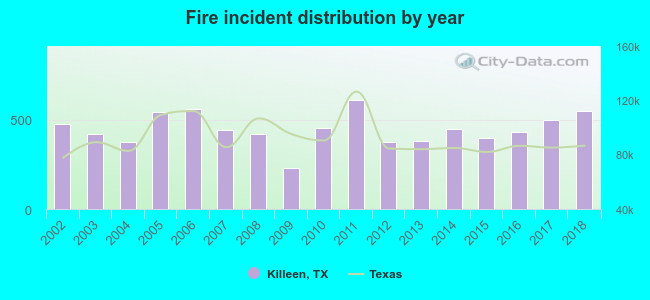 According to the data from the years 2002 - 2018 the average number of fires per year is 448. The highest number of reported fires - 609 took place in 2011, and the least - 231 in 2009. The data has an increasing trend.
The average number of yearly fire incidents per 10k residents in Killeen, TX compared to nearest cities:
(Note: Based on data for the last 3 years, including only cities with population 5,000 and above)
| Killeen: | 35.7 |
| Fort Hood: | 0.7 |
| Harker Heights: | 32.6 |
| Copperas Cove: | 38.1 |
| Belton: | 41.4 |
| Temple: | 47.9 |
| Gatesville: | 122.6 |
| Jarrell: | 52.8 |
| Lampasas: | 98.3 |
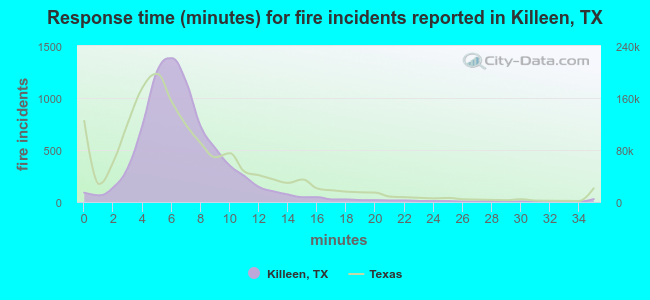 The median response time based on all reported fire incidents is 6 minutes. This is about the same as the Texas median value.
The median response time in Killeen, TX compared to nearest cities:
(Note: Based on data for all years, including only cities with at least 500 fire incidents)
| Killeen: | 6 minutes |
| Harker Heights: | 6 minutes |
| Copperas Cove: | 5 minutes |
| Kempner: | 13 minutes |
| Salado: | 9 minutes |
| Belton: | 7 minutes |
| Florence: | 10 minutes |
| Temple: | 6 minutes |
| Gatesville: | 10 minutes |
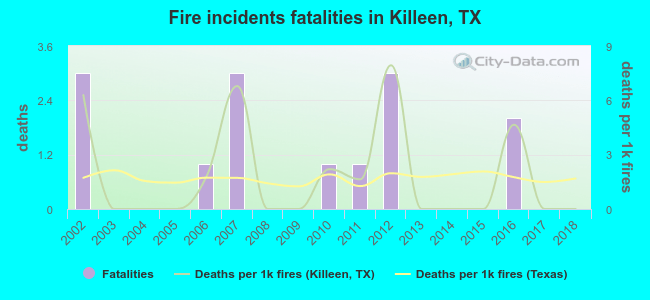 Based on the data from the years 2002 - 2018 the average number of fire-related fatalities per year is 1. The highest number of reported deaths - 3 took place in 2002, and the lowest - 0 in 2003. The data has a declining trend.
The average number of fatalities per 1,000 fire incidents is 2. This indicator was the highest - 8 in 2012, and the lowest 0 in 2003. The trend for deaths per 1,000 fires is decreasing. Compared to the Texas value the number of fatalities per 1,000 incidents is similar.
Based on the data from the years 2002 - 2018 the average number of fire-related fatalities per year is 1. The highest number of reported deaths - 3 took place in 2002, and the lowest - 0 in 2003. The data has a declining trend.
The average number of fatalities per 1,000 fire incidents is 2. This indicator was the highest - 8 in 2012, and the lowest 0 in 2003. The trend for deaths per 1,000 fires is decreasing. Compared to the Texas value the number of fatalities per 1,000 incidents is similar.Deaths per 1,000 incidents in Killeen, TX compared to nearest cities:
(Note: Based on data for all years, including only cities with at least 2,500 fire incidents)
| Killeen: | 1.8 |
| Copperas Cove: | 1.1 |
| Temple: | 2.9 |
| Gatesville: | 2.9 |
| Georgetown: | 1.2 |
| Round Rock: | 0.7 |
| Waco: | 3.1 |
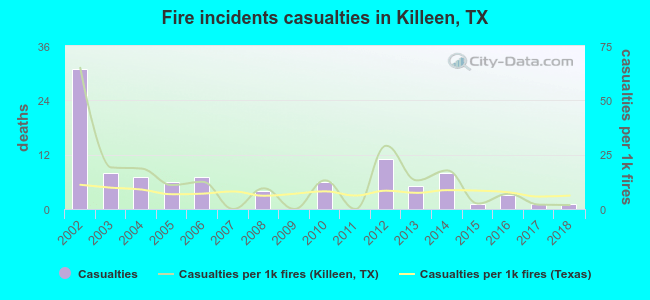 Based on the reports from the years 2002 - 2018 the average number of fire-related casualties per year is 6. The highest number of casualties - 31 took place in 2002, and the lowest - 0 in 2007. The data has a declining trend.
The average number of casualties per 1,000 fires is 13. This indicator was the highest - 65 in 2002, and the lowest 0 in 2007. The trend for casualties per 1,000 fire incidents is decreasing. Compared to the Texas value the number of casualties per 1,000 incidents is higher.
Based on the reports from the years 2002 - 2018 the average number of fire-related casualties per year is 6. The highest number of casualties - 31 took place in 2002, and the lowest - 0 in 2007. The data has a declining trend.
The average number of casualties per 1,000 fires is 13. This indicator was the highest - 65 in 2002, and the lowest 0 in 2007. The trend for casualties per 1,000 fire incidents is decreasing. Compared to the Texas value the number of casualties per 1,000 incidents is higher.Casualties per 1,000 incidents in Killeen, TX compared to nearest cities:
(Note: Based on data for all years, including only cities with at least 500 fire incidents)
| Killeen: | 13.0 |
| Harker Heights: | 16.6 |
| Copperas Cove: | 26.7 |
| Kempner: | 4.6 |
| Salado: | 0.0 |
| Belton: | 9.1 |
| Florence: | 7.4 |
| Temple: | 23.6 |
| Gatesville: | 11.2 |
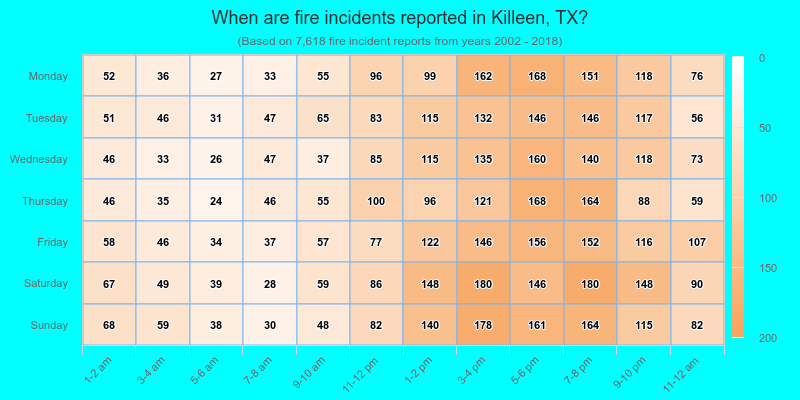
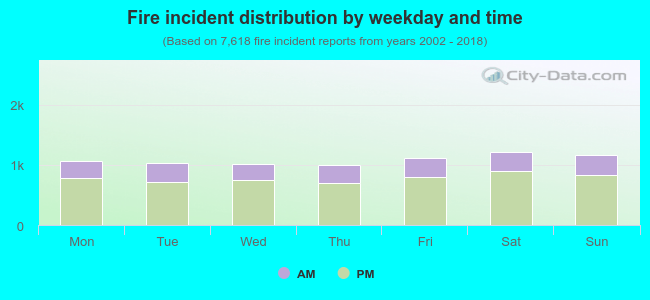 28.4% incidents where reported in the morning and 71.6% in the evening. The most fires (16.0%) took place on Saturday, and the least (13.2%) on Thursday.
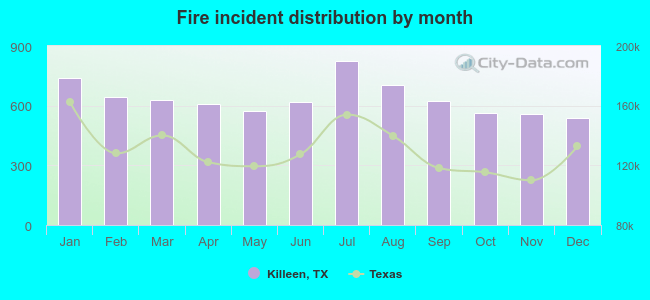 According to the 7,618 fires from years 2002 - 2018 most fires (10.8%) took place during July, and the least (7.0%) in December.
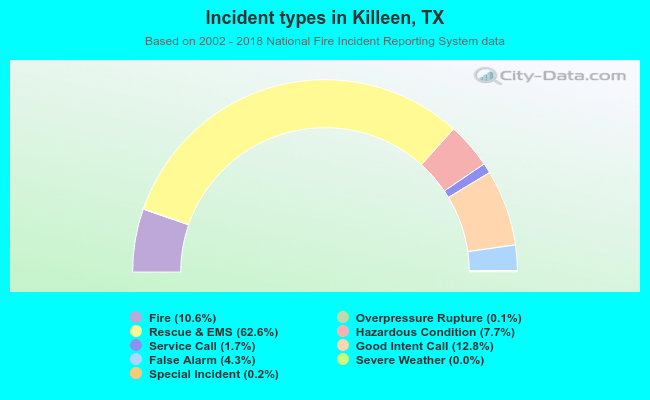 Out of all 71,802 cases reported during the years 2002 - 2018, the most belonged to the categories: Rescue & EMS (62.6%), Good Intent Call (12.8%), and Fire (10.6%).
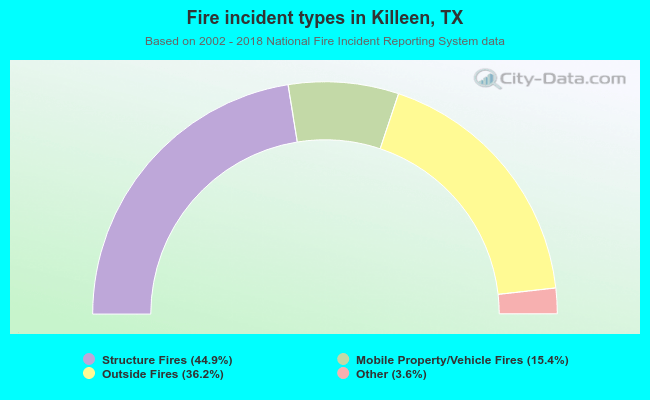 When looking into fire subcategories, the most incidents belonged to: Structure Fires (44.9%), and Outside Fires (36.2%).