Jarrell: Fire Incidents, Texas (TX)
Where are fire incidents reported in Jarrell, TX
Something went wrong! Please refresh the page.
|
| |||||||||||||||||||||||||||||||||||||||||||||||||||||||||||||||||||||||||||||||||||||||||||||||||||||||||||||
2003 - 2018 National Fire Incident Reporting System (NFIRS) incidents
- Incident types reported to NFIRS in Jarrell, TX
- 1,43646.3%Rescue & EMS
- 55918.0%Fire
- 42713.8%Good Intent Call
- 32410.4%Service Call
- 2809.0%Hazardous Condition
- 732.4%False Alarm
- Fire incident types reported to NFIRS in Jarrell, TX
- 36064.4%Outside Fires
- 9917.7%Mobile Property/Vehicle Fires
- 9617.2%Structure Fires
- 40.7%Other
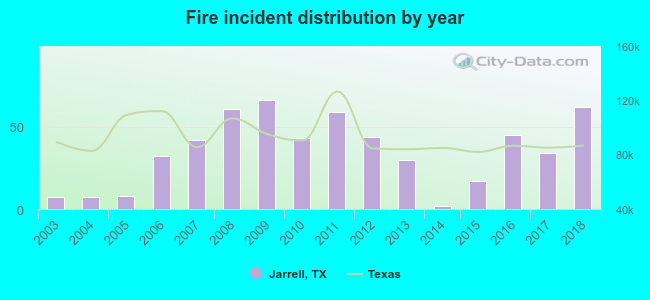 According to the data from the years 2003 - 2018 the average number of fires per year is 35. The highest number of reported fires - 66 took place in 2009, and the least - 2 in 2014. The data has an increasing trend.
The average number of yearly fire incidents per 10k residents in Jarrell, TX compared to nearest cities:
(Note: Based on data for the last 3 years, including only cities with population 5,000 and above)
| Jarrell: | 52.8 |
| Georgetown: | 32.1 |
| Hutto: | 42.8 |
| Taylor: | 46.1 |
| Round Rock: | 17.3 |
| Leander: | 38.0 |
| Pflugerville: | 20.1 |
| Harker Heights: | 32.6 |
| Cedar Park: | 18.8 |
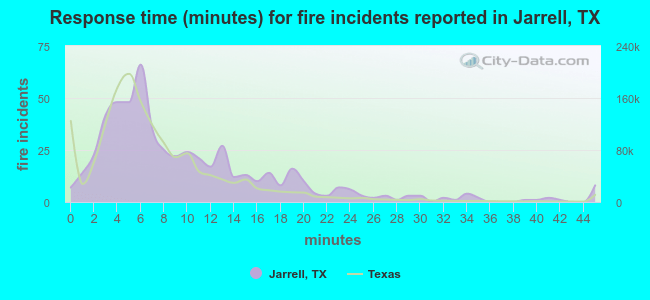 The median response time based on all reported fire incidents is 7 minutes. This is about the same as the state median value.
The median response time in Jarrell, TX compared to nearest cities:
(Note: Based on data for all years, including only cities with at least 500 fire incidents)
| Jarrell: | 7 minutes |
| Georgetown: | 7 minutes |
| Florence: | 10 minutes |
| Salado: | 9 minutes |
| Hutto: | 8 minutes |
| Taylor: | 7 minutes |
| Round Rock: | 5 minutes |
| Liberty Hill: | 10 minutes |
| Leander: | 7 minutes |
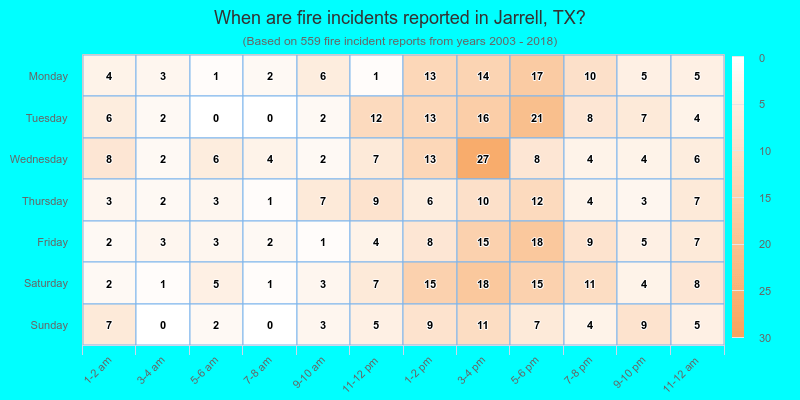
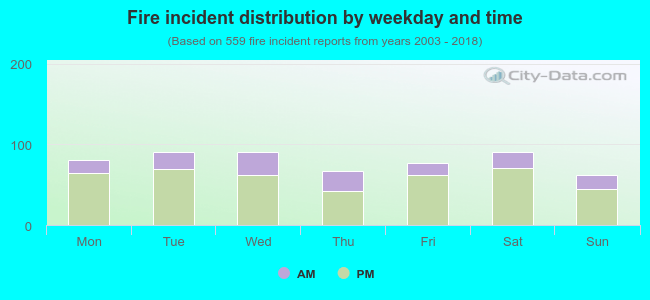 25.8% incidents where reported in the morning and 74.2% in the evening. The most fires (16.3%) took place on Tuesday, and the least (11.1%) on Sunday.
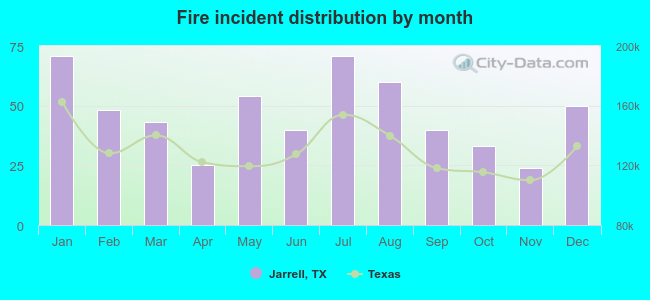 According to the 559 fires from years 2003 - 2018 most fires (12.7%) took place during January, and the least (4.3%) in November.
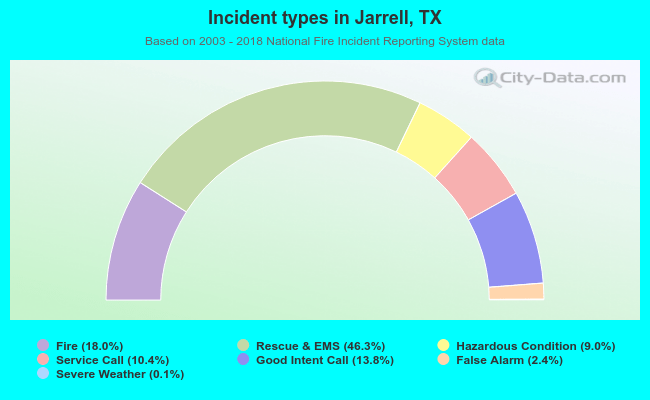 Out of all 3,102 cases reported during the years 2003 - 2018, the most belonged to the categories: Overpressure Rupture (46.3%), Fire (18.0%), and Service Call (13.8%).
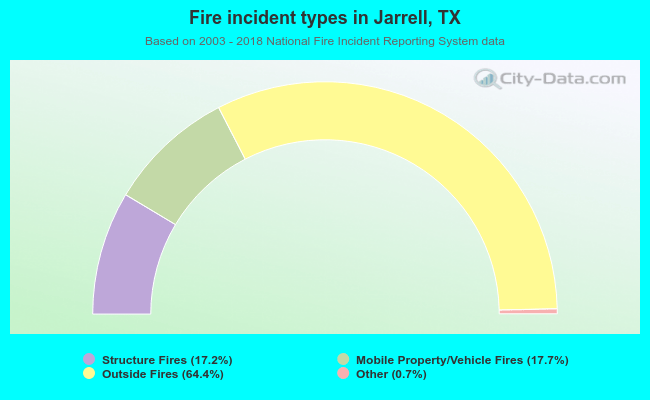 When looking into fire subcategories, the most reports belonged to: Outside Fires (64.4%), and Mobile Property/Vehicle Fires (17.7%).