Johnson City: Fire Incidents, Tennessee (TN)
Where are fire incidents reported in Johnson City, TN
Something went wrong! Please refresh the page.
| Fire incidents reported | |
|---|---|
| Sreet name | Count |
| ROAN ST | 660 |
| MARKET ST | 300 |
| STATE OF FRANKLIN RD | 298 |
| MAIN ST | 210 |
| WATAUGA AVE | 184 |
| BRISTOL HWY | 166 |
| FAIRVIEW AVE | 156 |
| WALNUT ST | 130 |
| I-26 | 112 |
| MYRTLE AVE | 106 |
| OAKLAND AVE | 104 |
| WOODLYN RD | 104 |
| BROWNS MILL RD | 102 |
| BROADWAY ST | 96 |
| CASH HOLLOW RD | 96 |
| DOSSETT DR | 94 |
| MAPLE ST | 88 |
| MCKINLEY RD | 86 |
| HAMILTON ST | 84 |
| UNAKA AVE | 84 |
| KNOB CREEK RD | 76 |
| PARDEE ST | 76 |
| LAMONT ST | 72 |
| CHEROKEE RD | 70 |
| DYER ST | 70 |
| SHERWOOD DR | 70 |
| I26 | 66 |
| UNIVERSITY PKY | 66 |
| LAKEVIEW DR | 64 |
| MILLARD ST | 62 |
| Other | 1,546 |
2002 - 2018 National Fire Incident Reporting System (NFIRS) incidents
- Incident types reported to NFIRS in Johnson City, TN
- 23,58950.5%Rescue & EMS
- 5,60812.0%Good Intent Call
- 5,49811.8%Fire
- 4,88410.4%False Alarm
- 3,5227.5%Hazardous Condition
- 3,4417.4%Service Call
- 1290.3%Overpressure Rupture
- 520.1%Special Incident
- Fire incident types reported to NFIRS in Johnson City, TN
- 2,23140.6%Outside Fires
- 2,15739.2%Structure Fires
- 95517.4%Mobile Property/Vehicle Fires
- 1552.8%Other
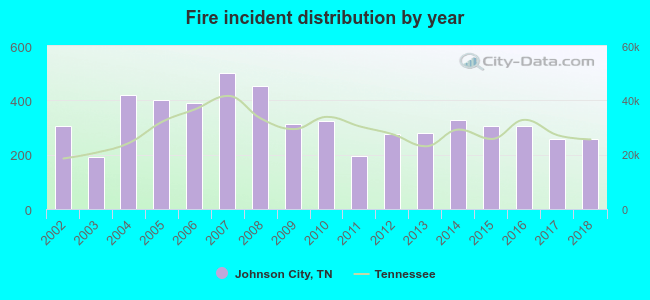 According to the data from the years 2002 - 2018 the average number of fire incidents per year is 323. The highest number of reported fire incidents - 499 took place in 2007, and the least - 193 in 2003. The data has a declining trend.
The average number of yearly fire incidents per 10k residents in Johnson City, TN compared to nearest cities:
(Note: Based on data for the last 3 years, including only cities with population 5,000 and above)
| Johnson City: | 41.4 |
| Jonesborough: | 178.8 |
| Elizabethton: | 92.5 |
| Colonial Heights: | 2.2 |
| Erwin: | 5.0 |
| Telford: | 10.5 |
| Kingsport: | 67.3 |
| Bloomingdale: | 1.0 |
| Bristol: | 54.5 |
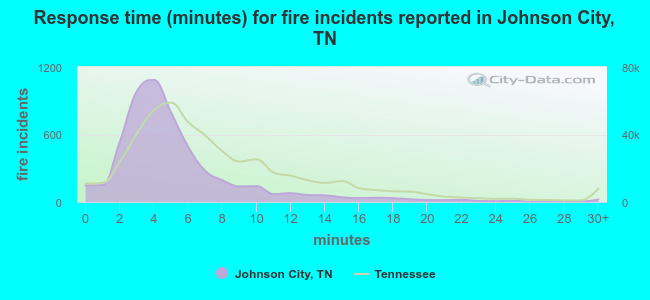 The median response time based on all reported fire incidents is 4 minutes. This is lower than the state median value.
The median response time in Johnson City, TN compared to nearest cities:
(Note: Based on data for all years, including only cities with at least 500 fire incidents)
| Johnson City: | 4 minutes |
| Jonesborough: | 9 minutes |
| Elizabethton: | 8 minutes |
| Gray: | 10 minutes |
| Bluff City: | 8 minutes |
| Blountville: | 11 minutes |
| Kingsport: | 7 minutes |
| Bristol: | 6 minutes |
| Church Hill: | 9 minutes |
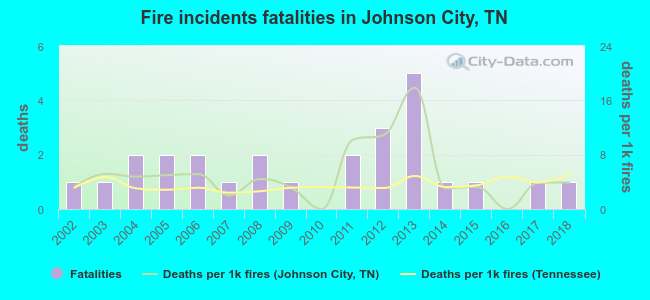 According to the reports from the years 2002 - 2018 the average number of fire-related yearly deaths is 2. The highest number of deaths - 5 took place in 2013, and the lowest - 0 in 2010. The data has a constant trend.
The average number of deaths per 1,000 fires is 5. This indicator was the highest - 18 in 2013, and the lowest 0 in 2010. The trend for deaths per 1,000 fire incidents is growing. Compared to the Tennessee value the number of deaths per 1,000 fire incidents is higher.
According to the reports from the years 2002 - 2018 the average number of fire-related yearly deaths is 2. The highest number of deaths - 5 took place in 2013, and the lowest - 0 in 2010. The data has a constant trend.
The average number of deaths per 1,000 fires is 5. This indicator was the highest - 18 in 2013, and the lowest 0 in 2010. The trend for deaths per 1,000 fire incidents is growing. Compared to the Tennessee value the number of deaths per 1,000 fire incidents is higher.Deaths per 1,000 incidents in Johnson City, TN compared to nearest cities:
(Note: Based on data for all years, including only cities with at least 2,500 fire incidents)
| Johnson City: | 4.7 |
| Elizabethton: | 2.2 |
| Kingsport: | 3.4 |
| Greeneville: | 3.6 |
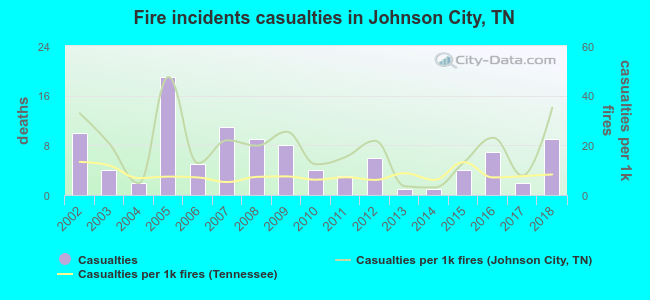 According to the reports from the years 2002 - 2018 the average number of fire-related yearly casualties is 6. The highest number of reported injuries - 19 took place in 2005, and the lowest - 1 in 2013. The data has a declining trend.
The average number of injuries per 1,000 fire incidents is 19. This indicator was the highest - 48 in 2005, and the lowest 3 in 2014. The trend for casualties per 1,000 fire incidents is rising. Compared to the state value the number of casualties per 1,000 incidents is much higher.
According to the reports from the years 2002 - 2018 the average number of fire-related yearly casualties is 6. The highest number of reported injuries - 19 took place in 2005, and the lowest - 1 in 2013. The data has a declining trend.
The average number of injuries per 1,000 fire incidents is 19. This indicator was the highest - 48 in 2005, and the lowest 3 in 2014. The trend for casualties per 1,000 fire incidents is rising. Compared to the state value the number of casualties per 1,000 incidents is much higher.Casualties per 1,000 incidents in Johnson City, TN compared to nearest cities:
(Note: Based on data for all years, including only cities with at least 500 fire incidents)
| Johnson City: | 19.1 |
| Jonesborough: | 2.9 |
| Elizabethton: | 14.3 |
| Gray: | 1.6 |
| Bluff City: | 6.0 |
| Blountville: | 4.1 |
| Kingsport: | 13.7 |
| Bristol: | 6.9 |
| Church Hill: | 4.2 |
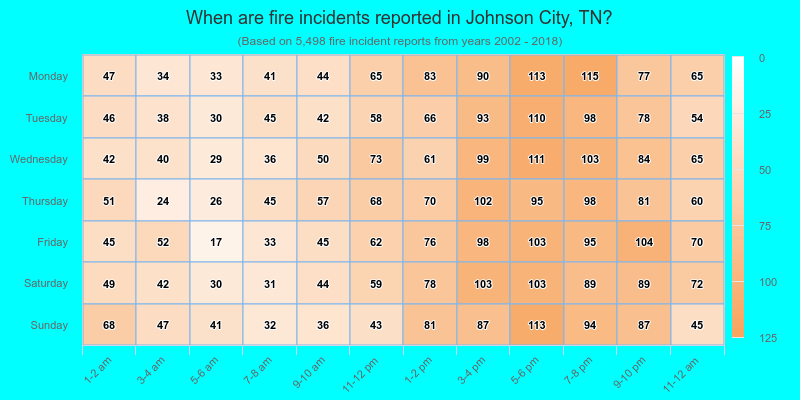
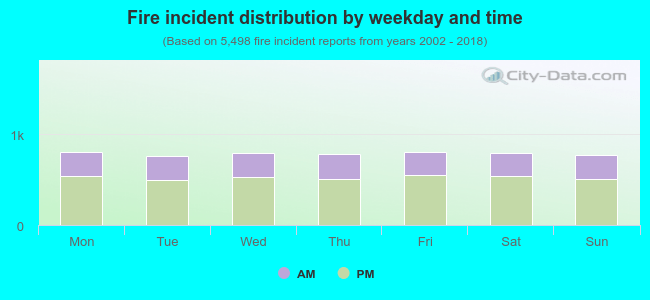 33.5% incidents where reported in the morning and 66.5% in the evening. The most fires (14.7%) took place on Monday, and the least (13.8%) on Tuesday.
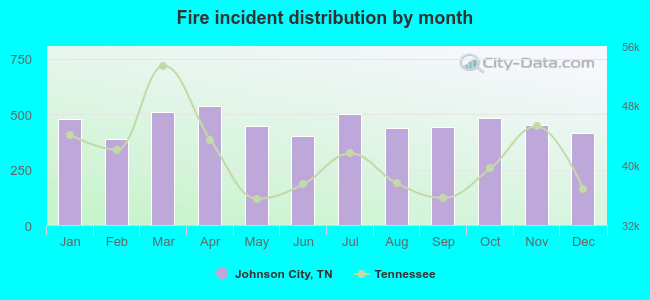 According to the 5,498 fire incident reports from years 2002 - 2018 most fires (9.8%) took place during April, and the least (7.0%) in February.
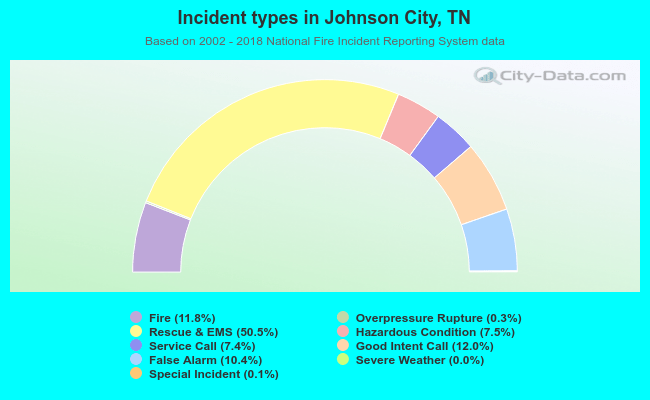 Out of all 46,745 cases reported during the years 2002 - 2018, the most belonged to the categories: Rescue & EMS (50.5%), Good Intent Call (12.0%), and Fire (11.8%).
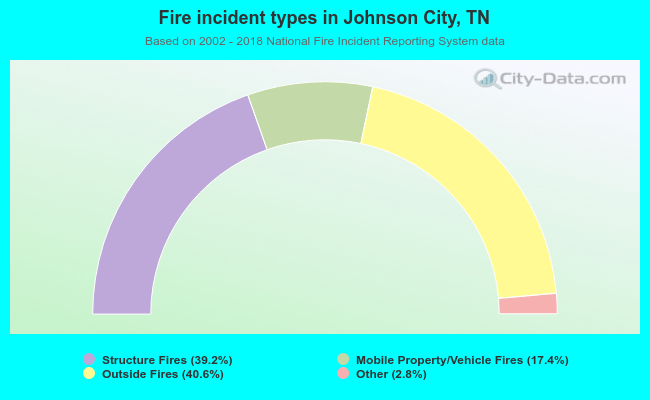 When looking into fire subcategories, the most incidents belonged to: Outside Fires (40.6%), and Structure Fires (39.2%).