Bristol: Fire Incidents, Tennessee (TN)
Where are fire incidents reported in Bristol, TN
Something went wrong! Please refresh the page.
| Fire incidents reported | |
|---|---|
| Sreet name | Count |
| SHELBY ST | 214 |
| ASH ST | 152 |
| STATE ST | 140 |
| WEAVER PIKE | 92 |
| VOLUNTEER PKWY | 82 |
| MOORE ST | 62 |
| ANDERSON ST | 54 |
| BRISTOL CAVERNS HWY | 50 |
| WINDSOR AVE | 50 |
| OLD JONESBORO RD | 48 |
| VOLUNTEER PKY | 48 |
| BRISTOL CAVERNS HWY | 46 |
| BROAD ST | 46 |
| VOLUNTEER | 44 |
| GEORGIA AVE | 40 |
| HWY 421 | 40 |
| MARY ST | 40 |
| PAPERVILLE RD | 40 |
| PENNSYLVANIA AVE | 38 |
| HIGHWAY 421 | 36 |
| MARYLAND AVE | 36 |
| BLUFF CITY HWY | 34 |
| CAROLINA AVE | 34 |
| HILL ST | 32 |
| KENTUCKY AVE | 32 |
| MEADOW VIEW RD | 30 |
| VANCE DR | 26 |
| VIRGINIA AVE | 26 |
| MEDICAL PARK BLVD | 22 |
| 5TH ST | 20 |
| Other | 663 |
2002 - 2018 National Fire Incident Reporting System (NFIRS) incidents
- Incident types reported to NFIRS in Bristol, TN
- 15,74067.1%Rescue & EMS
- 2,3179.9%Fire
- 1,3945.9%Good Intent Call
- 1,3185.6%Service Call
- 1,2715.4%Hazardous Condition
- 1,0404.4%False Alarm
- 3471.5%Overpressure Rupture
- 330.1%Special Incident
- Fire incident types reported to NFIRS in Bristol, TN
- 1,10347.6%Structure Fires
- 78433.8%Outside Fires
- 29312.6%Mobile Property/Vehicle Fires
- 1375.9%Other
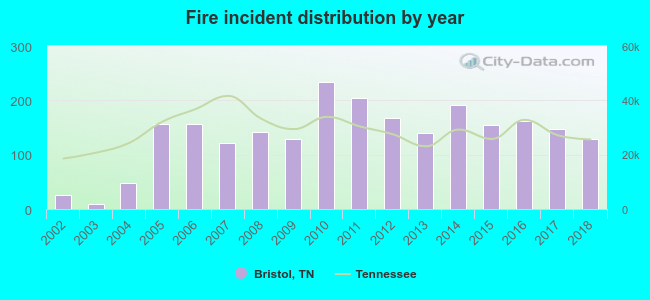 According to the data from the years 2002 - 2018 the average number of fire incidents per year is 136. The highest number of reported fires - 233 took place in 2010, and the least - 10 in 2003. The data has a rising trend.
The average number of yearly fire incidents per 10k residents in Bristol, TN compared to nearest cities:
(Note: Based on data for the last 3 years, including only cities with population 5,000 and above)
| Bristol: | 54.5 |
| Elizabethton: | 92.5 |
| Bloomingdale: | 1.0 |
| Colonial Heights: | 2.2 |
| Johnson City: | 41.4 |
| Kingsport: | 67.3 |
| Jonesborough: | 178.8 |
| Mount Carmel: | 44.6 |
| Church Hill: | 52.3 |
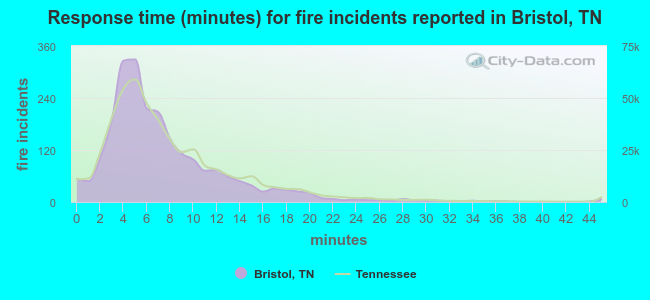 The median response time based on all reported fire incidents is 6 minutes. This is similar to the state median value.
The median response time in Bristol, TN compared to nearest cities:
(Note: Based on data for all years, including only cities with at least 500 fire incidents)
| Bristol: | 6 minutes |
| Blountville: | 11 minutes |
| Bluff City: | 8 minutes |
| Elizabethton: | 8 minutes |
| Gray: | 10 minutes |
| Johnson City: | 4 minutes |
| Kingsport: | 7 minutes |
| Mountain City: | 13 minutes |
| Jonesborough: | 9 minutes |
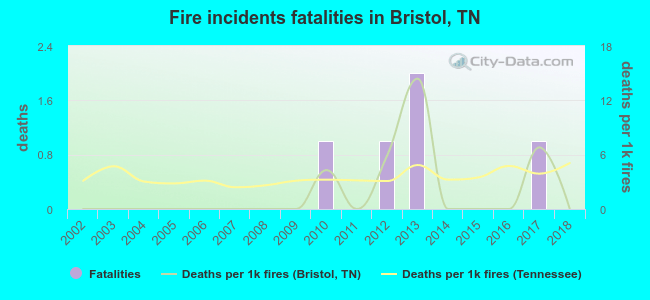 According to the reports from the years 2002 - 2018 the average number of fire-related yearly deaths is 0. The highest number of deaths - 2 took place in 2013, and the lowest - 0 in 2002. The data has a constant trend.
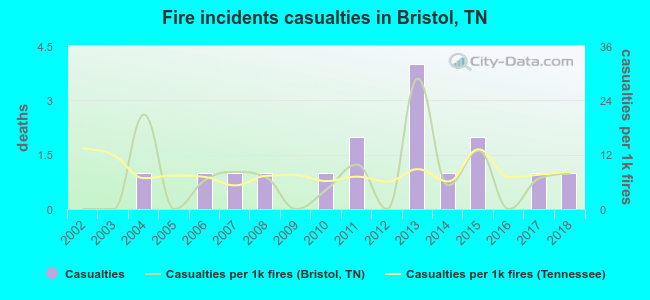 According to the reports from the years 2002 - 2018 the average number of fire-related casualties per year is 1. The highest number of reported injuries - 4 took place in 2013, and the lowest - 0 in 2002. The data has a growing trend.
The average number of casualties per 1,000 fires is 7. This indicator was the highest - 29 in 2013, and the lowest 0 in 2002. The trend for casualties per 1,000 fires is rising. Compared to the state value the number of casualties per 1,000 fires is similar.
According to the reports from the years 2002 - 2018 the average number of fire-related casualties per year is 1. The highest number of reported injuries - 4 took place in 2013, and the lowest - 0 in 2002. The data has a growing trend.
The average number of casualties per 1,000 fires is 7. This indicator was the highest - 29 in 2013, and the lowest 0 in 2002. The trend for casualties per 1,000 fires is rising. Compared to the state value the number of casualties per 1,000 fires is similar.Casualties per 1,000 incidents in Bristol, TN compared to nearest cities:
(Note: Based on data for all years, including only cities with at least 500 fire incidents)
| Bristol: | 6.9 |
| Blountville: | 4.1 |
| Bluff City: | 6.0 |
| Elizabethton: | 14.3 |
| Gray: | 1.6 |
| Johnson City: | 19.1 |
| Kingsport: | 13.7 |
| Mountain City: | 1.2 |
| Jonesborough: | 2.9 |
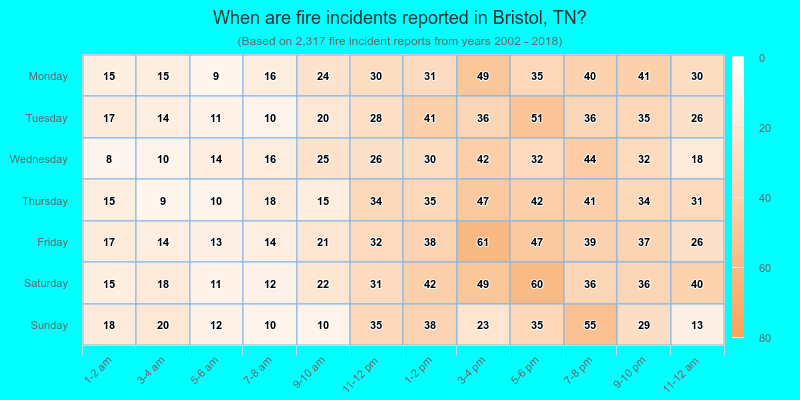
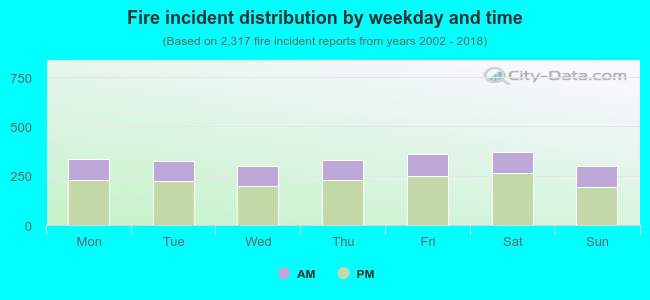 31.7% incidents where reported in the morning and 68.3% in the evening. The most fires (16.1%) took place on Saturday, and the least (12.8%) on Wednesday.
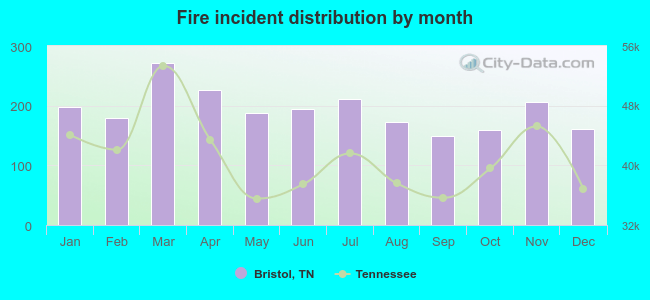 Based on the 2,317 fire incident reports from years 2002 - 2018 most fires (11.7%) took place during March, and the least (6.5%) in September.
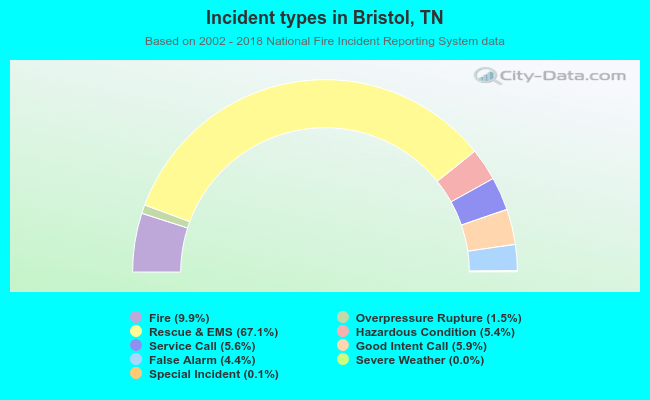 Out of all 23,465 cases reported during the years 2002 - 2018, the most belonged to the categories: Rescue & EMS (67.1%), Fire (9.9%), and Good Intent Call (5.9%).
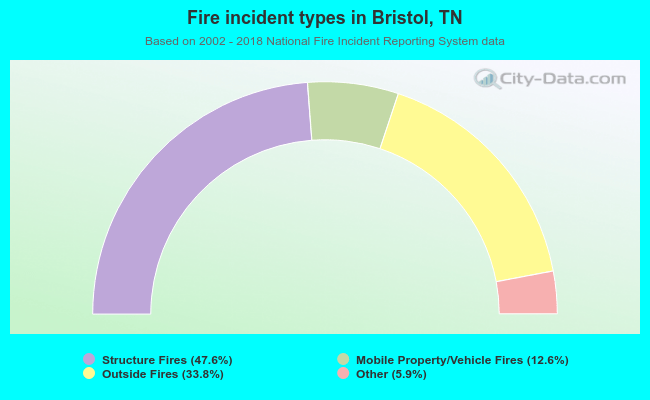 When looking into fire subcategories, the most reports belonged to: Structure Fires (47.6%), and Outside Fires (33.8%).