Jenks: Fire Incidents, Oklahoma (OK)
Where are fire incidents reported in Jenks, OK
Something went wrong! Please refresh the page.
| Fire incidents reported | |
|---|---|
| Sreet name | Count |
| MAIN ST | 58 |
| ELM ST | 36 |
| ELWOOD | 36 |
| CREEK TURNPIKE | 30 |
| 111TH ST | 28 |
| ELM | 28 |
| YALE PL | 26 |
| B ST | 20 |
| MAIN | 20 |
| K PL | 18 |
| PEORIA | 18 |
| S 33RD W AVE | 18 |
| S HWY 75 | 18 |
| 117TH ST | 16 |
| 121ST ST | 16 |
| HWY 75 | 16 |
| S ELM ST | 16 |
| S ELWOOD | 16 |
| UNION | 16 |
| 1ST ST | 14 |
| 5TH ST | 14 |
| BEAVER ST | 14 |
| HARVARD | 14 |
| 101ST ST | 12 |
| 118TH ST | 12 |
| 131ST ST | 12 |
| APACHE ST | 12 |
| BIRCH | 12 |
| DATE | 12 |
| DATE ST | 12 |
| Other | 387 |
2002 - 2018 National Fire Incident Reporting System (NFIRS) incidents
- Incident types reported to NFIRS in Jenks, OK
- 4,87055.8%Rescue & EMS
- 97711.2%Fire
- 94410.8%Hazardous Condition
- 7038.1%False Alarm
- 6317.2%Good Intent Call
- 5346.1%Service Call
- 270.3%Special Incident
- 230.3%Overpressure Rupture
- 120.1%Severe Weather
- Fire incident types reported to NFIRS in Jenks, OK
- 51452.6%Outside Fires
- 23824.4%Structure Fires
- 12412.7%Mobile Property/Vehicle Fires
- 10110.3%Other
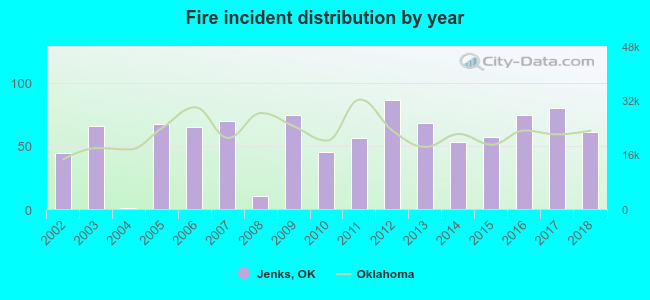 Based on the data from the years 2002 - 2018 the average number of fires per year is 57. The highest number of fire incidents - 86 took place in 2012, and the least - 1 in 2004. The data has a rising trend.
The average number of yearly fire incidents per 10k residents in Jenks, OK compared to nearest cities:
(Note: Based on data for the last 3 years, including only cities with population 5,000 and above)
| Jenks: | 35.9 |
| Glenpool: | 49.5 |
| Bixby: | 20.1 |
| Sapulpa: | 90.7 |
| Tulsa: | 50.9 |
| Broken Arrow: | 20.0 |
| Sand Springs: | 130.8 |
| Catoosa: | 95.6 |
| Coweta: | 31.5 |
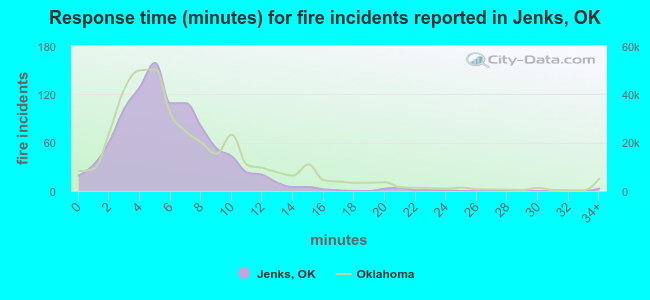 The median response time based on all reported fire incidents is 5 minutes. This is lower than the state median value.
The median response time in Jenks, OK compared to nearest cities:
(Note: Based on data for all years, including only cities with at least 500 fire incidents)
| Jenks: | 5 minutes |
| Glenpool: | 4 minutes |
| Bixby: | 5 minutes |
| Sapulpa: | 5 minutes |
| Tulsa: | 4 minutes |
| Broken Arrow: | 6 minutes |
| Sand Springs: | 6 minutes |
| Catoosa: | 7 minutes |
| Beggs: | 10 minutes |
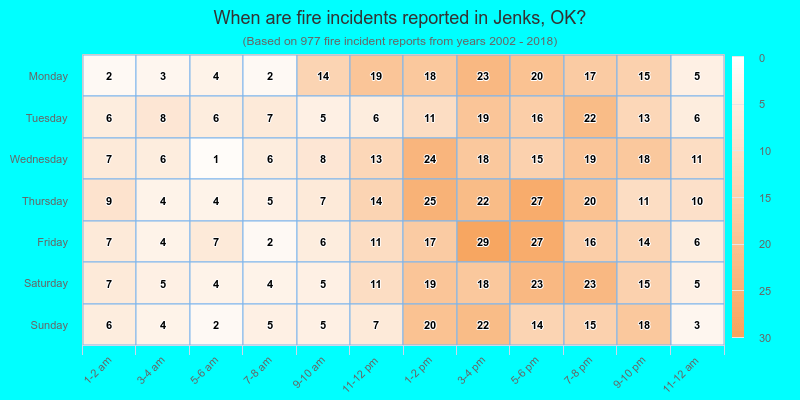
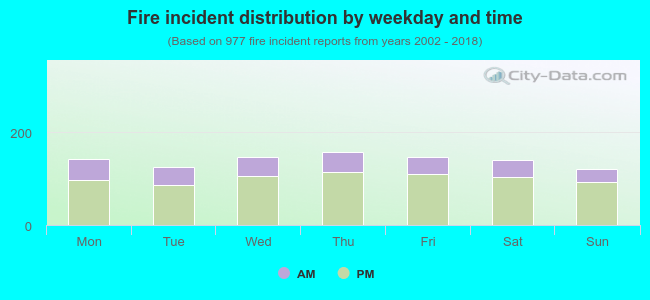 27.4% incidents where reported in the morning and 72.6% in the evening. The most fires (16.2%) took place on Thursday, and the least (12.4%) on Sunday.
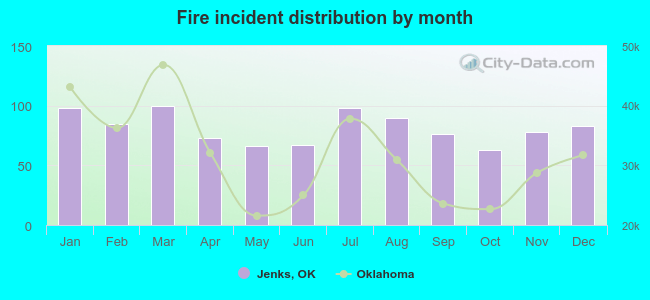 Based on the 977 fire incidents from years 2002 - 2018 most fires (10.2%) took place during March, and the least (6.4%) in October.
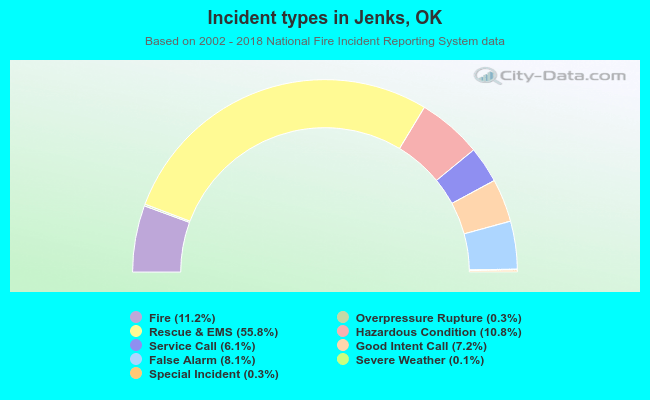 Out of all 8,721 cases reported during the years 2002 - 2018, the most belonged to the categories: Rescue & EMS (55.8%), Fire (11.2%), and Hazardous Condition (10.8%).
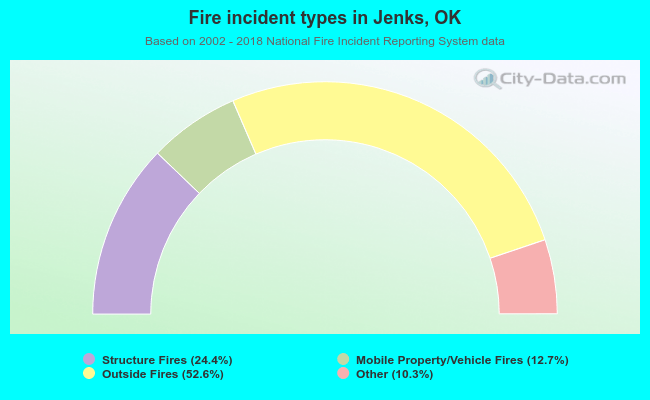 When looking into fire subcategories, the most reports belonged to: Outside Fires (52.6%), and Structure Fires (24.4%).