Glenpool: Fire Incidents, Oklahoma (OK)
Where are fire incidents reported in Glenpool, OK
Something went wrong! Please refresh the page.
|
| |||||||||||||||||||||||||||||||||||||||||||||||||||||||||||||||||||||||||||||||||||||||||||||||||||||||||||||
| Other | 99 | |||||||||||||||||||||||||||||||||||||||||||||||||||||||||||||||||||||||||||||||||||||||||||||||||||||||||||||
2003 - 2018 National Fire Incident Reporting System (NFIRS) incidents
- Incident types reported to NFIRS in Glenpool, OK
- 3,59954.6%Rescue & EMS
- 82412.5%Hazardous Condition
- 80512.2%Fire
- 6059.2%Service Call
- 5167.8%Good Intent Call
- 2223.4%False Alarm
- 130.2%Severe Weather
- 90.1%Overpressure Rupture
- Fire incident types reported to NFIRS in Glenpool, OK
- 48760.5%Outside Fires
- 18623.1%Structure Fires
- 11013.7%Mobile Property/Vehicle Fires
- 222.7%Other
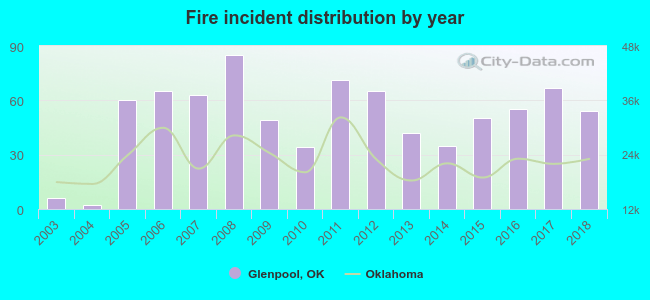 According to the data from the years 2003 - 2018 the average number of fires per year is 50. The highest number of fire incidents - 85 took place in 2008, and the least - 2 in 2004. The data has a growing trend.
The average number of yearly fire incidents per 10k residents in Glenpool, OK compared to nearest cities:
(Note: Based on data for the last 3 years, including only cities with population 5,000 and above)
| Glenpool: | 49.5 |
| Jenks: | 35.9 |
| Sapulpa: | 90.7 |
| Bixby: | 20.1 |
| Tulsa: | 50.9 |
| Broken Arrow: | 20.0 |
| Sand Springs: | 130.8 |
| Coweta: | 31.5 |
| Catoosa: | 95.6 |
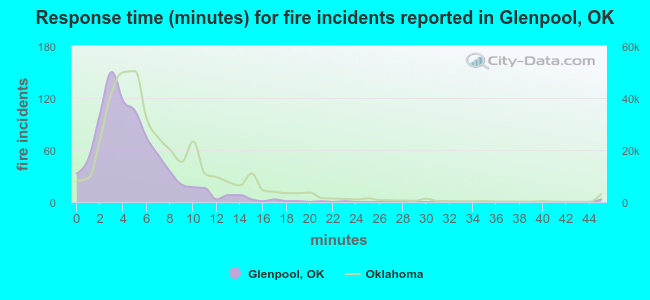 The median response time based on all reported fire incidents is 4 minutes. This is lower than the Oklahoma median value.
The median response time in Glenpool, OK compared to nearest cities:
(Note: Based on data for all years, including only cities with at least 500 fire incidents)
| Glenpool: | 4 minutes |
| Jenks: | 5 minutes |
| Sapulpa: | 5 minutes |
| Bixby: | 5 minutes |
| Tulsa: | 4 minutes |
| Beggs: | 10 minutes |
| Broken Arrow: | 6 minutes |
| Sand Springs: | 6 minutes |
| Coweta: | 6 minutes |
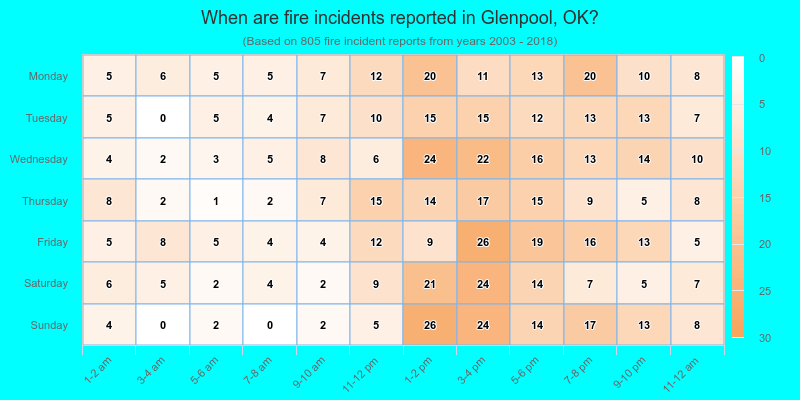
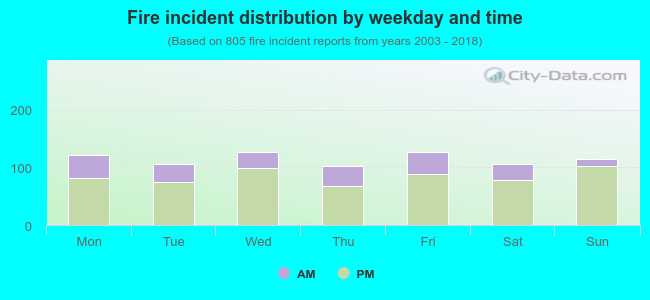 26.5% incidents where reported in the morning and 73.5% in the evening. The most fires (15.8%) took place on Wednesday, and the least (12.8%) on Thursday.
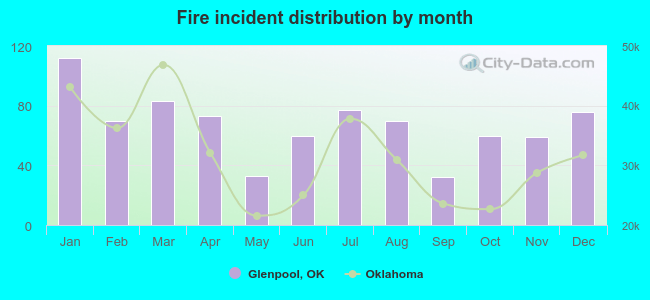 According to the 805 reports from years 2003 - 2018 most fires (13.9%) took place during January, and the least (4.0%) in September.
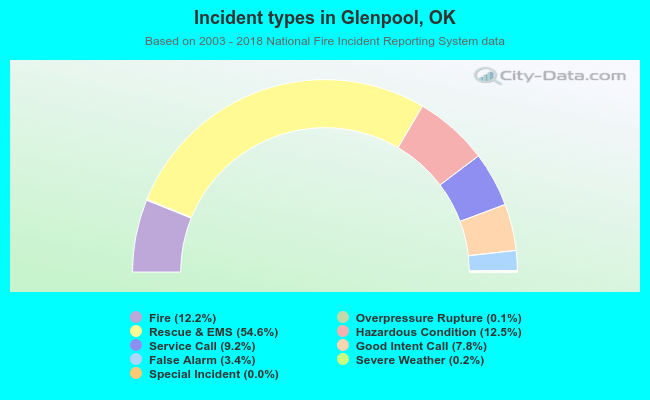 Out of all 6,594 cases reported during the years 2003 - 2018, the most belonged to the categories: Rescue & EMS (54.6%), Hazardous Condition (12.5%), and Fire (12.2%).
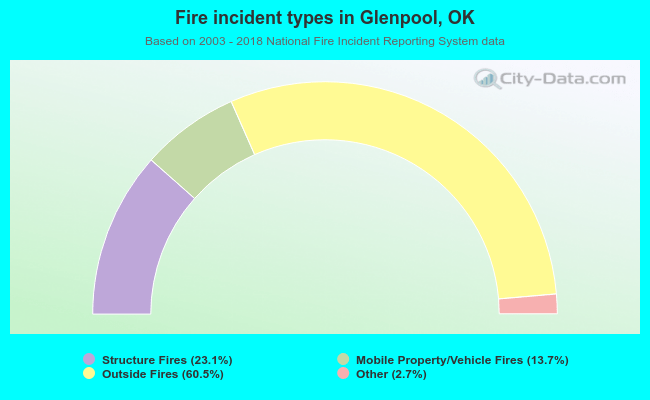 When looking into fire subcategories, the most incidents belonged to: Outside Fires (60.5%), and Structure Fires (23.1%).