Hopewell: Fire Incidents, Virginia (VA)
Where are fire incidents reported in Hopewell, VA
Something went wrong! Please refresh the page.
| Fire incidents reported | |
|---|---|
| Sreet name | Count |
| OAKLAWN BLVD | 182 |
| RANDOLPH RD | 90 |
| INDUSTRIAL ST | 72 |
| WINSTON CHURCHILL DR | 70 |
| BROADWAY | 64 |
| RIVER RD | 60 |
| JAMES RIVER DR | 50 |
| 295 HWY | 48 |
| CITY POINT RD | 48 |
| OLD IRON CT | 46 |
| HERCULES RD | 44 |
| 15TH AVE | 38 |
| COURTHOUSE RD | 38 |
| 9TH AVE | 36 |
| POYTHRESS ST | 32 |
| GRANBY ST | 30 |
| OLD IRON RD | 30 |
| PLAZA DR | 30 |
| 6TH AVE | 28 |
| CAWSON ST | 28 |
| 8TH AVE | 26 |
| FREEMAN ST | 26 |
| KIPPAX ST | 26 |
| NORFOLK ST | 26 |
| POPLAR ST | 26 |
| TRENTON ST | 26 |
| WARREN AVE | 26 |
| WESTERN ST | 26 |
| ELM ST | 24 |
| LIBERTY AVE | 24 |
| Other | 360 |
2002 - 2018 National Fire Incident Reporting System (NFIRS) incidents
- Incident types reported to NFIRS in Hopewell, VA
- 9,81855.8%Rescue & EMS
- 3,37519.2%Hazardous Condition
- 1,6809.5%Fire
- 1,6169.2%Service Call
- 6383.6%False Alarm
- 4362.5%Good Intent Call
- Fire incident types reported to NFIRS in Hopewell, VA
- 74344.2%Structure Fires
- 61036.3%Outside Fires
- 27016.1%Mobile Property/Vehicle Fires
- 573.4%Other
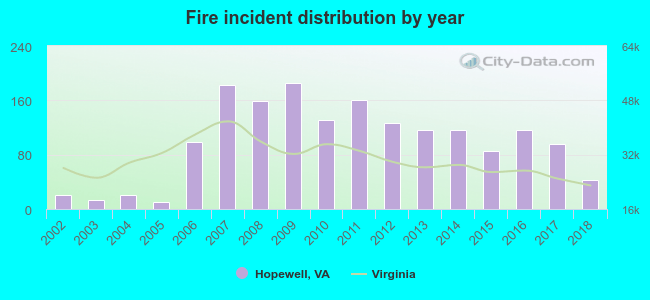 Based on the data from the years 2002 - 2018 the average number of fires per year is 99. The highest number of fires - 185 took place in 2009, and the least - 10 in 2005. The data has a growing trend.
The average number of yearly fire incidents per 10k residents in Hopewell, VA compared to nearest cities:
(Note: Based on data for the last 3 years, including only cities with population 5,000 and above)
| Hopewell: | 38.1 |
| Colonial Heights: | 44.9 |
| Ettrick: | 11.2 |
| Petersburg: | 39.0 |
| Chester: | 80.8 |
| Bellwood: | 45.7 |
| Bensley: | 56.7 |
| Sandston: | 66.5 |
| Highland Springs: | 22.3 |
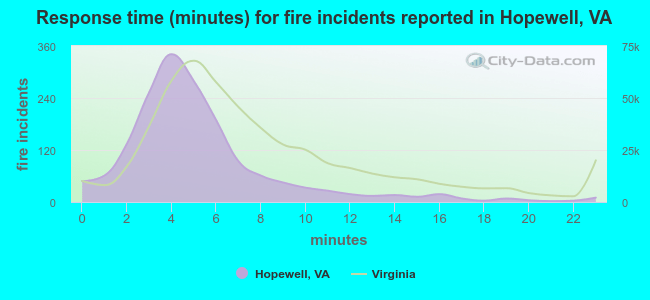 The median response time based on all reported fire incidents is 5 minutes. This is lower compared to the state median value.
The median response time in Hopewell, VA compared to nearest cities:
(Note: Based on data for all years, including only cities with at least 500 fire incidents)
| Hopewell: | 5 minutes |
| Prince George: | 8 minutes |
| Colonial Heights: | 6 minutes |
| Petersburg: | 6 minutes |
| Chester: | 6 minutes |
| Charles City: | 16 minutes |
| Sandston: | 6 minutes |
| Highland Springs: | 5 minutes |
| Richmond: | 5 minutes |
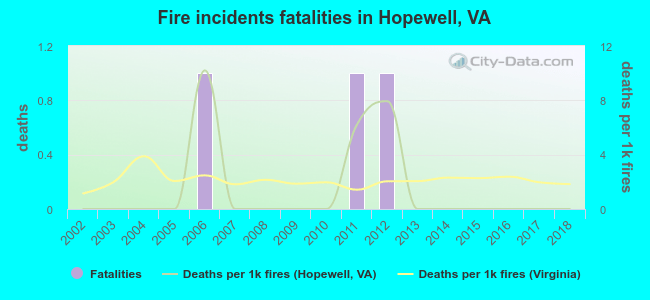 According to the reports from the years 2002 - 2018 the average number of fire-related fatalities per year is 0. The highest number of deaths - 1 took place in 2006, and the lowest - 0 in 2002. The data has a constant trend.
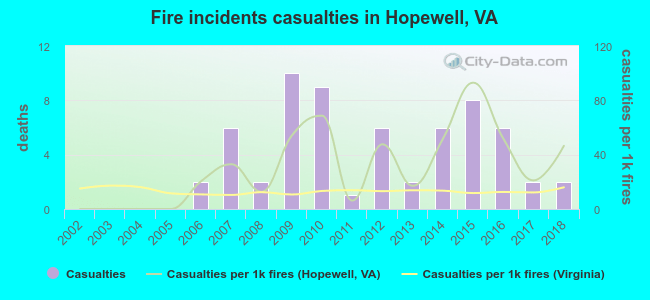 Based on the reports from the years 2002 - 2018 the average number of fire-related casualties per year is 4. The highest number of casualties - 10 took place in 2009, and the lowest - 0 in 2002. The data has a rising trend.
The average number of casualties per 1,000 fire incidents is 31. This indicator was the highest - 93 in 2015, and the lowest 0 in 2002. The trend for casualties per 1,000 fire incidents is increasing. Compared to the Virginia value the number of injuries per 1,000 fire incidents is much higher.
Based on the reports from the years 2002 - 2018 the average number of fire-related casualties per year is 4. The highest number of casualties - 10 took place in 2009, and the lowest - 0 in 2002. The data has a rising trend.
The average number of casualties per 1,000 fire incidents is 31. This indicator was the highest - 93 in 2015, and the lowest 0 in 2002. The trend for casualties per 1,000 fire incidents is increasing. Compared to the Virginia value the number of injuries per 1,000 fire incidents is much higher.Casualties per 1,000 incidents in Hopewell, VA compared to nearest cities:
(Note: Based on data for all years, including only cities with at least 500 fire incidents)
| Hopewell: | 36.9 |
| Prince George: | 3.7 |
| Colonial Heights: | 45.2 |
| Petersburg: | 46.1 |
| Chester: | 40.8 |
| Charles City: | 0.0 |
| Sandston: | 18.9 |
| Highland Springs: | 44.5 |
| Richmond: | 26.0 |
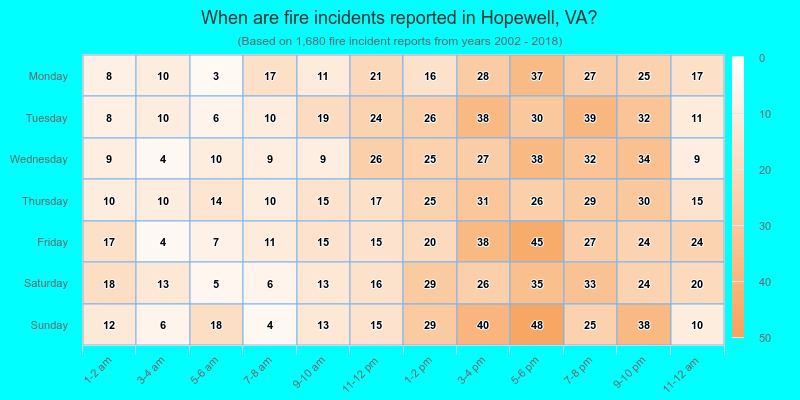
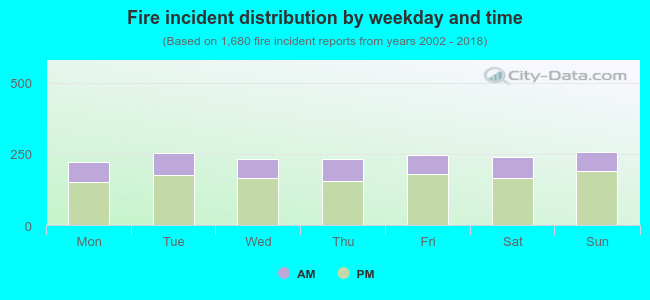 29.6% incidents where reported in the morning and 70.4% in the evening. The most fires (15.4%) took place on Sunday, and the least (13.1%) on Monday.
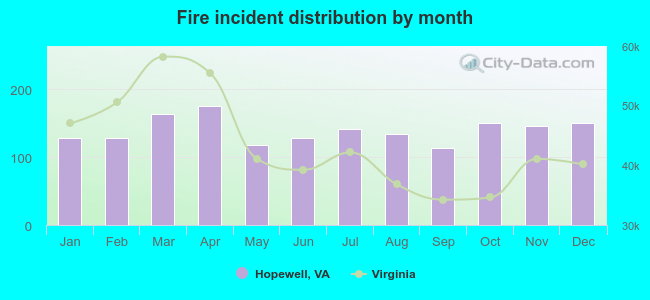 Based on the 1,680 reports from years 2002 - 2018 most fires (10.5%) took place during April, and the least (6.8%) in September.
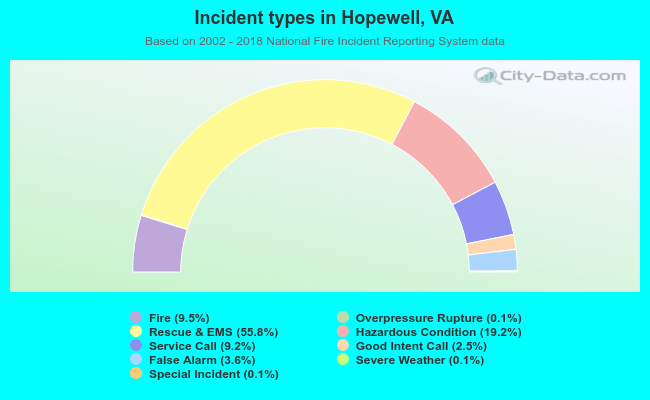 Out of all 17,606 cases reported during the years 2002 - 2018, the most belonged to the categories: Rescue & EMS (55.8%), Hazardous Condition (19.2%), and Fire (9.5%).
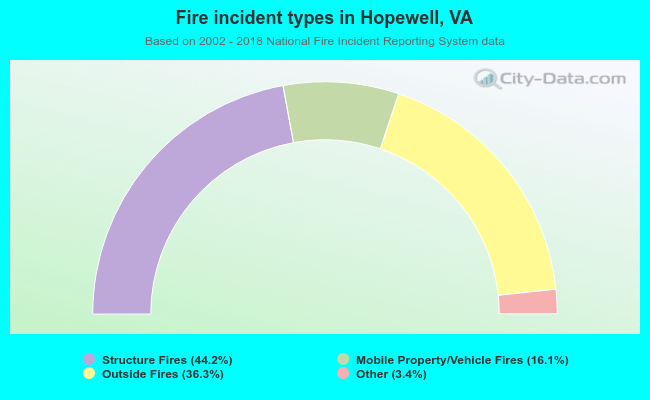 When looking into fire subcategories, the most reports belonged to: Structure Fires (44.2%), and Outside Fires (36.3%).