Chester: Fire Incidents, Virginia (VA)
Where are fire incidents reported in Chester, VA
Something went wrong! Please refresh the page.
| Fire incidents reported | |
|---|---|
| Sreet name | Count |
| HUNDRED RD | 450 |
| JEFFERSON DAVIS HWY | 352 |
| HARROWGATE RD | 76 |
| ENON CHURCH RD | 62 |
| OLD STAGE RD | 60 |
| PERDUE SPRINGS DR | 58 |
| CHESTER RD | 56 |
| IRON BRIDGE RD | 56 |
| KINGSTON AVE | 56 |
| BERMUDA CROSSROAD LN | 54 |
| COXENDALE RD | 54 |
| BRANDERS BRIDGE RD | 52 |
| 95WOODS EDGE10 | 50 |
| IRON BRIDGE PLZ | 40 |
| OSBORNE RD | 40 |
| BERMUDA HUNDRED RD | 36 |
| QUIET PINE CIR | 34 |
| RAMBLEWOOD DR | 34 |
| REDWATER CREEK RD | 34 |
| CREEK WAY | 30 |
| GREAT BRANCH DR | 30 |
| 9510288 | 28 |
| 9528810 | 28 |
| BROADWATER WAY | 28 |
| COUGAR TRL | 28 |
| CURTIS ST | 28 |
| 9510WOODS EDGE | 26 |
| CLIFFSIDE DR | 26 |
| WARE BOTTOM SPRING RD | 26 |
| ECOFF AVE | 24 |
| Other | 546 |
2004 - 2018 National Fire Incident Reporting System (NFIRS) incidents
- Incident types reported to NFIRS in Chester, VA
- 19,80965.1%Rescue & EMS
- 2,5028.2%Fire
- 2,4197.9%Hazardous Condition
- 2,3017.6%Service Call
- 1,9096.3%Good Intent Call
- 1,3224.3%False Alarm
- 1560.5%Overpressure Rupture
- Fire incident types reported to NFIRS in Chester, VA
- 1,00840.3%Outside Fires
- 90836.3%Structure Fires
- 56022.4%Mobile Property/Vehicle Fires
- 261.0%Other
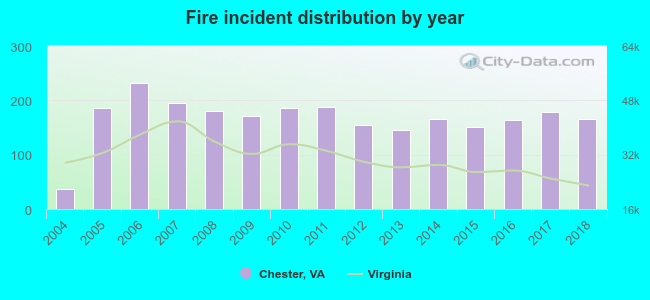 Based on the data from the years 2004 - 2018 the average number of fires per year is 167. The highest number of fire incidents - 232 took place in 2006, and the least - 36 in 2004. The data has an increasing trend.
The average number of yearly fire incidents per 10k residents in Chester, VA compared to nearest cities:
(Note: Based on data for the last 3 years, including only cities with population 5,000 and above)
| Chester: | 80.8 |
| Bellwood: | 45.7 |
| Colonial Heights: | 44.9 |
| Bensley: | 56.7 |
| Ettrick: | 11.2 |
| Hopewell: | 38.1 |
| Petersburg: | 39.0 |
| Richmond: | 66.9 |
| Sandston: | 66.5 |
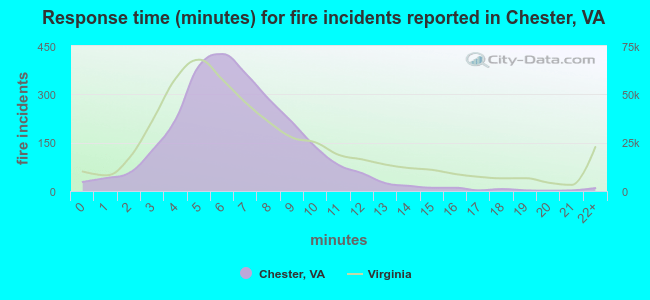 The median response time based on all reported fire incidents is 6 minutes. This is similar to the Virginia median value.
The median response time in Chester, VA compared to nearest cities:
(Note: Based on data for all years, including only cities with at least 500 fire incidents)
| Chester: | 6 minutes |
| Colonial Heights: | 6 minutes |
| Hopewell: | 5 minutes |
| Petersburg: | 6 minutes |
| Prince George: | 8 minutes |
| Richmond: | 5 minutes |
| Sandston: | 6 minutes |
| Highland Springs: | 5 minutes |
| Mechanicsville: | 8 minutes |
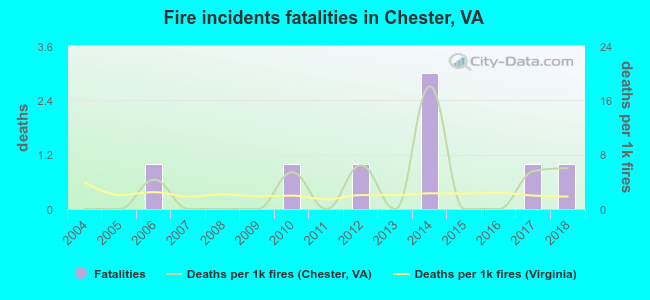 Based on the reports from the years 2004 - 2018 the average number of fire-related yearly deaths is 1. The highest number of deaths - 3 took place in 2014, and the lowest - 0 in 2004. The data has a rising trend.
The average number of deaths per 1,000 fire incidents is 3. This indicator was the highest - 18 in 2014, and the lowest 0 in 2004. The trend for fatalities per 1,000 incidents is increasing. Compared to the Virginia value the number of fatalities per 1,000 fire incidents is higher.
Based on the reports from the years 2004 - 2018 the average number of fire-related yearly deaths is 1. The highest number of deaths - 3 took place in 2014, and the lowest - 0 in 2004. The data has a rising trend.
The average number of deaths per 1,000 fire incidents is 3. This indicator was the highest - 18 in 2014, and the lowest 0 in 2004. The trend for fatalities per 1,000 incidents is increasing. Compared to the Virginia value the number of fatalities per 1,000 fire incidents is higher.Deaths per 1,000 incidents in Chester, VA compared to nearest cities:
(Note: Based on data for all years, including only cities with at least 2,500 fire incidents)
| Chester: | 3.2 |
| Petersburg: | 2.8 |
| Richmond: | 2.2 |
| Mechanicsville: | 0.8 |
| Williamsburg: | 2.2 |
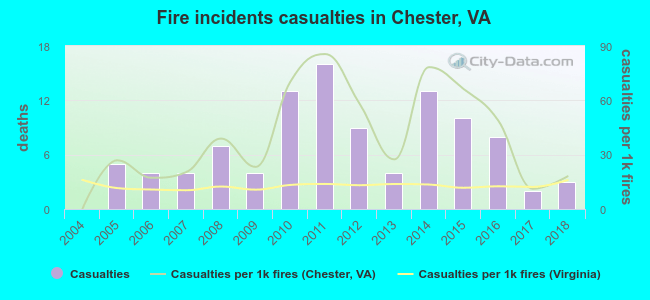 According to the data from the years 2004 - 2018 the average number of fire-related yearly casualties is 7. The highest number of reported casualties - 16 took place in 2011, and the lowest - 0 in 2004. The data has an increasing trend.
The average number of casualties per 1,000 fires is 39. This indicator was the highest - 86 in 2011, and the lowest 0 in 2004. The trend for injuries per 1,000 incidents is rising. Compared to the state value the number of injuries per 1,000 fire incidents is much higher.
According to the data from the years 2004 - 2018 the average number of fire-related yearly casualties is 7. The highest number of reported casualties - 16 took place in 2011, and the lowest - 0 in 2004. The data has an increasing trend.
The average number of casualties per 1,000 fires is 39. This indicator was the highest - 86 in 2011, and the lowest 0 in 2004. The trend for injuries per 1,000 incidents is rising. Compared to the state value the number of injuries per 1,000 fire incidents is much higher.Casualties per 1,000 incidents in Chester, VA compared to nearest cities:
(Note: Based on data for all years, including only cities with at least 500 fire incidents)
| Chester: | 40.8 |
| Colonial Heights: | 45.2 |
| Hopewell: | 36.9 |
| Petersburg: | 46.1 |
| Prince George: | 3.7 |
| Richmond: | 26.0 |
| Sandston: | 18.9 |
| Highland Springs: | 44.5 |
| Mechanicsville: | 4.6 |
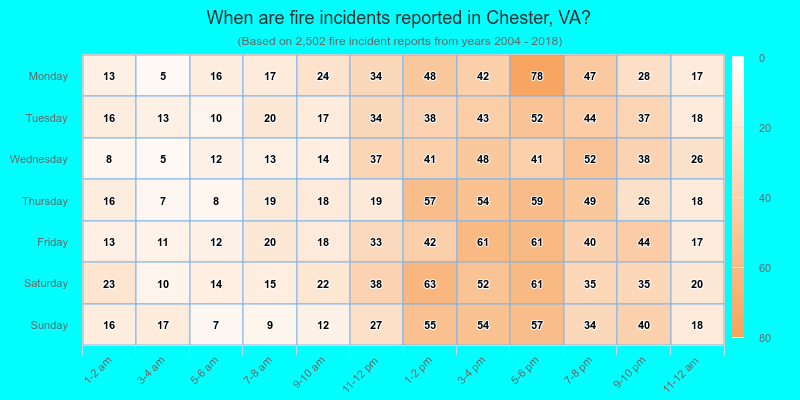
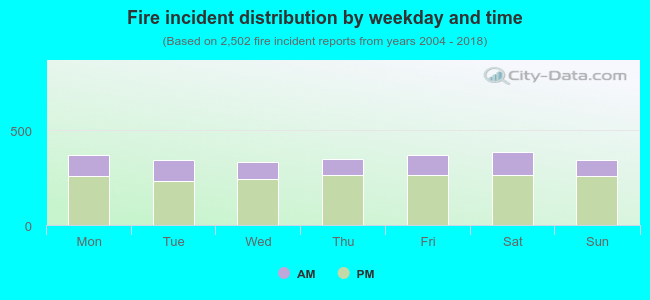 28.5% incidents where reported in the morning and 71.5% in the evening. The most fires (15.5%) took place on Saturday, and the least (13.4%) on Wednesday.
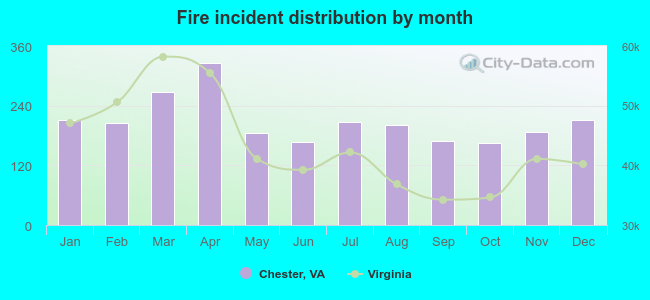 According to the 2,502 fires from years 2004 - 2018 most fires (13.0%) took place during April, and the least (6.6%) in October.
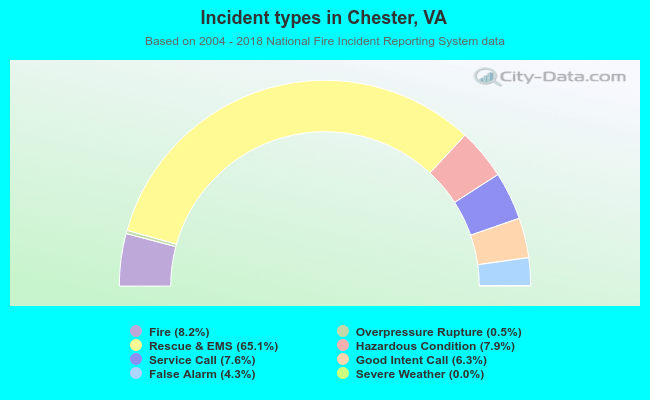 Out of all 30,430 cases reported during the years 2004 - 2018, the most belonged to the categories: Rescue & EMS (65.1%), Fire (8.2%), and Hazardous Condition (7.9%).
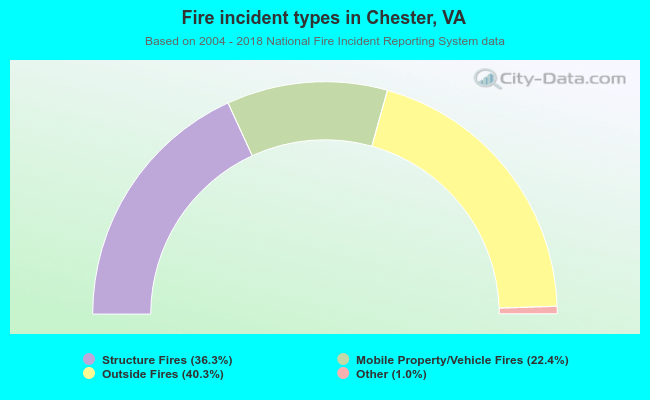 When looking into fire subcategories, the most incidents belonged to: Outside Fires (40.3%), and Structure Fires (36.3%).