| Fire incidents reported |
|---|
| Sreet name | Count |
|---|
| I88 | 28 | | 284TH ST | 18 | | HILLSDALE | 16 | | 38TH AVENUE N | 6 | | JACKSON ST | 6 | | ROUTE 2 N | 6 | | RT 2 | 6 | | 108TH AVE | 4 | | 122ND AVE | 4 | | 248TH STREET N | 4 | | 265TH ST | 4 | | 27605 - 57TH AVE | 4 | | 28424-38TH AV | 4 | | 28606 - 38TH AVE | 4 | | 307 ST | 4 | | 33126 - 66TH AVE | 4 | | 34TH AVE | 4 | | 34TH AVENUE N | 4 | | 38 AVE | 4 | | 38TH AVE N | 4 | | 5016 - 290TH ST | 4 | | HILLSDALE FIRE DEPT. | 4 | | I-88 | 4 | | MAIN STREET | 4 | | MAIN STREET LGTS | 4 |
| | | Fire incidents reported |
|---|
| Sreet name | Count |
|---|
| MOLINE ROAD | 4 | | 0524 CHASE RD | 2 | | 101 AVE | 2 | | 101 FERRY RD | 2 | | 101ST AVE | 2 | | 10414 - 317TH ST | 2 | | 10414-317TH STRE | 2 | | 10729317TH ST | 2 | | 108TH AVENUE | 2 | | 108TH AVENUE N | 2 | | 115 AVE | 2 | | 115TH AVE | 2 | | 11626 - 298TH STREET N. | 2 | | 11701 - 317TH ST | 2 | | 11907 - 277TH ST | 2 | | 122 AVE N | 2 | | 12300 BLK 277 TH ST N | 2 | | 12717 291ST ST N | 2 | | 12717291ST ST | 2 | | 13501 - 277TH ST | 2 | | 150TH AVE N | 2 | | 192ND AVE | 2 | | 1ST AVE | 2 | | 1ST AVENUE NORTH | 2 | | |
|
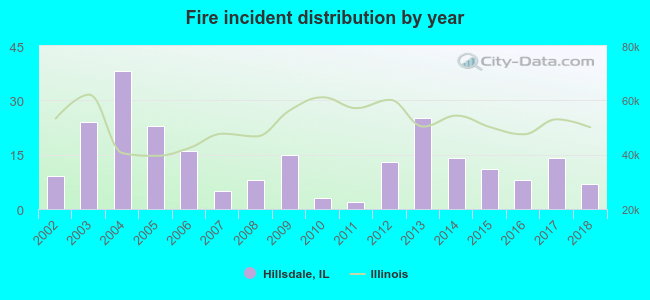 Based on the data from the years 2002 - 2018 the average number of fire incidents per year is 14. The highest number of reported fire incidents - 38 took place in 2004, and the least - 2 in 2011. The data has a dropping trend.
 31.5% incidents where reported in the morning and 68.5% in the evening. The most fires (25.1%) took place on Saturday, and the least (9.4%) on Wednesday.
 Based on the 235 incident reports from years 2002 - 2018 most fires (24.7%) took place during April, and the least (3.0%) in January.
 Out of all 705 cases reported during the years 2002 - 2018, the most belonged to the categories: Rescue & EMS (33.6%), Fire (33.3%), and Good Intent Call (14.8%).
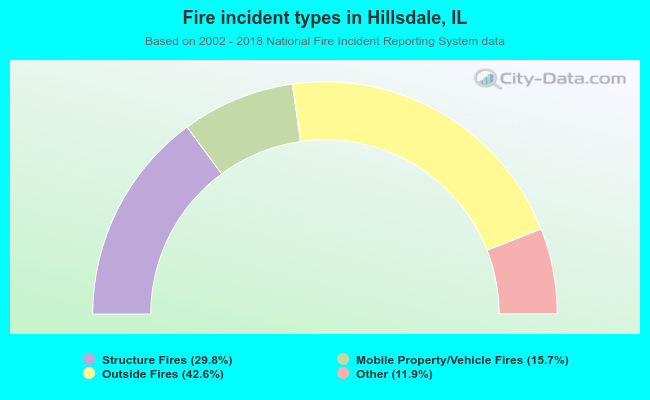 When looking into fire subcategories, the most reports belonged to: Outside Fires (42.6%), and Structure Fires (29.8%).