Hastings: Fire Incidents, Nebraska (NE)
Where are fire incidents reported in Hastings, NE
Something went wrong! Please refresh the page.
| Fire incidents reported | |
|---|---|
| Sreet name | Count |
| 2ND ST | 134 |
| BALTIMORE AVE | 114 |
| BURLINGTON AVE | 100 |
| SOUTH ST | 100 |
| 7TH ST | 94 |
| 12TH ST | 84 |
| 5TH ST | 84 |
| HASTINGS AVE | 76 |
| J ST | 76 |
| 3RD ST | 74 |
| OSBORNE DR | 70 |
| PINE AVE | 70 |
| KANSAS AVE | 68 |
| MARIAN RD | 68 |
| LINCOLN AVE | 56 |
| LEXINGTON AVE | 54 |
| 6TH ST | 50 |
| 14TH ST | 48 |
| SHOWBOAT BLVD | 46 |
| BELLEVUE AVE | 42 |
| MINNESOTA AVE | 42 |
| COLORADO AVE | 40 |
| DENVER AVE | 40 |
| WABASH AVE | 38 |
| 4TH ST | 36 |
| ST JOSEPH AVE | 36 |
| ADAMS CENTRAL AVE | 34 |
| SOUTHERN HILLS DR | 34 |
| E ST | 32 |
| PARK ST | 32 |
| Other | 131 |
2002 - 2018 National Fire Incident Reporting System (NFIRS) incidents
- Incident types reported to NFIRS in Hastings, NE
- 8,23350.4%Rescue & EMS
- 2,01312.3%Hazardous Condition
- 2,00312.3%Fire
- 1,5169.3%Good Intent Call
- 1,3328.1%False Alarm
- 1,1757.2%Service Call
- 370.2%Overpressure Rupture
- 310.2%Special Incident
- Fire incident types reported to NFIRS in Hastings, NE
- 95147.5%Outside Fires
- 62431.2%Structure Fires
- 32316.1%Mobile Property/Vehicle Fires
- 1055.2%Other
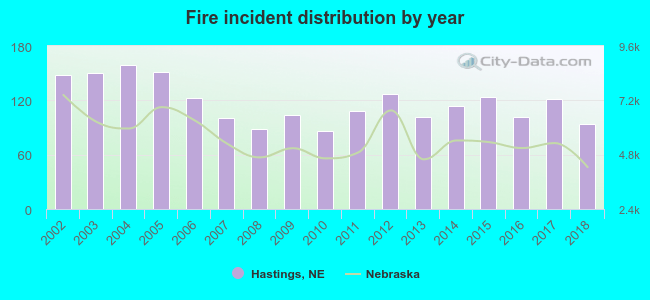 According to the data from the years 2002 - 2018 the average number of fires per year is 118. The highest number of reported fire incidents - 159 took place in 2004, and the least - 86 in 2010. The data has a declining trend.
The average number of yearly fire incidents per 10k residents in Hastings, NE compared to nearest cities:
(Note: Based on data for the last 3 years, including only cities with population 5,000 and above)
| Hastings: | 42.5 |
| Grand Island: | 19.1 |
| Kearney: | 1.2 |
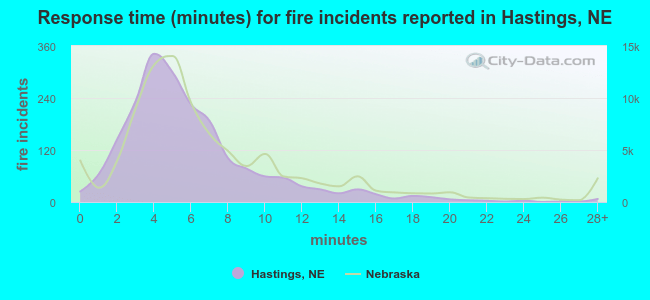 The median response time based on all reported fire incidents is 5 minutes. This is lower compared to the Nebraska median value.
The median response time in Hastings, NE compared to nearest cities:
(Note: Based on data for all years, including only cities with at least 500 fire incidents)
| Hastings: | 5 minutes |
| Grand Island: | 5 minutes |
| Kearney: | 6 minutes |
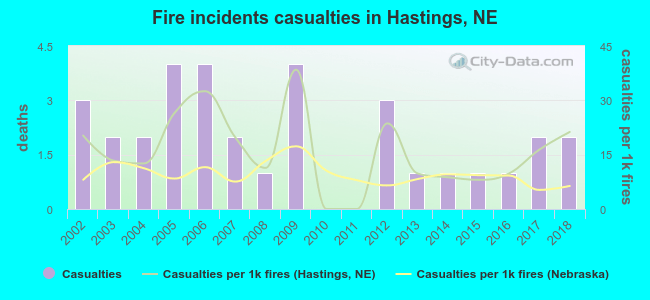 Based on the reports from the years 2002 - 2018 the average number of fire-related yearly casualties is 2. The highest number of reported injuries - 4 took place in 2005, and the lowest - 0 in 2010. The data has a dropping trend.
The average number of casualties per 1,000 fires is 16. This indicator was the highest - 38 in 2009, and the lowest 0 in 2010. The trend for injuries per 1,000 incidents is increasing. Compared to the state value the number of casualties per 1,000 incidents is higher.
Based on the reports from the years 2002 - 2018 the average number of fire-related yearly casualties is 2. The highest number of reported injuries - 4 took place in 2005, and the lowest - 0 in 2010. The data has a dropping trend.
The average number of casualties per 1,000 fires is 16. This indicator was the highest - 38 in 2009, and the lowest 0 in 2010. The trend for injuries per 1,000 incidents is increasing. Compared to the state value the number of casualties per 1,000 incidents is higher.Casualties per 1,000 incidents in Hastings, NE compared to nearest cities:
(Note: Based on data for all years, including only cities with at least 500 fire incidents)
| Hastings: | 16.5 |
| Grand Island: | 11.1 |
| Kearney: | 7.0 |
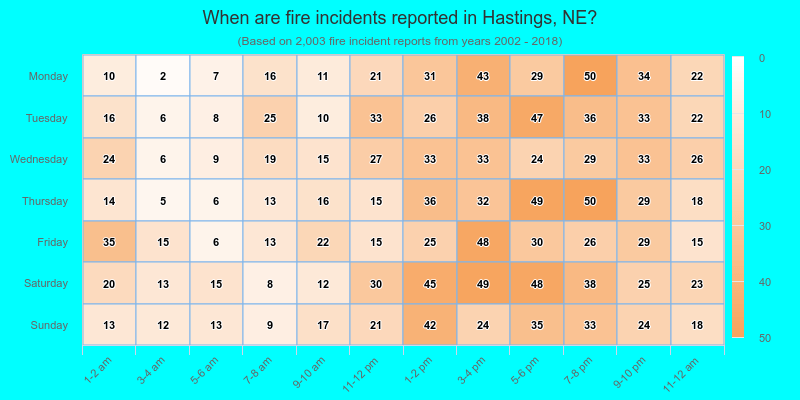
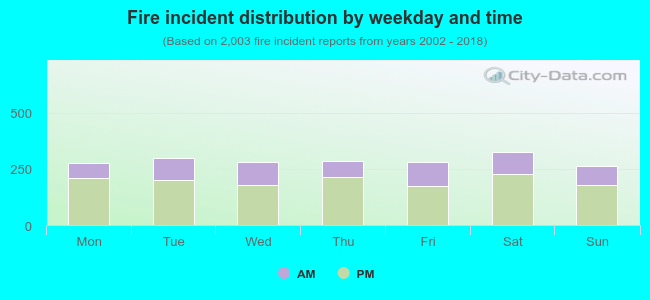 31.1% incidents where reported in the morning and 68.9% in the evening. The most fires (16.3%) took place on Saturday, and the least (13.0%) on Sunday.
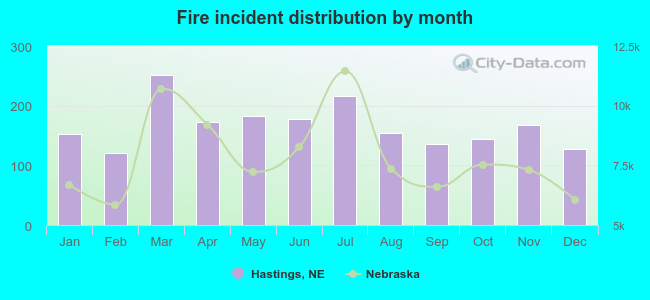 Based on the 2,003 fire incident reports from years 2002 - 2018 most fires (12.6%) took place during March, and the least (6.0%) in February.
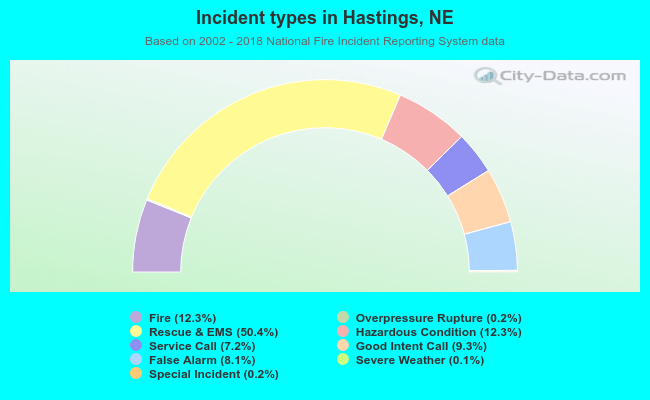 Out of all 16,350 cases reported during the years 2002 - 2018, the most belonged to the categories: Rescue & EMS (50.4%), Hazardous Condition (12.3%), and Fire (12.3%).
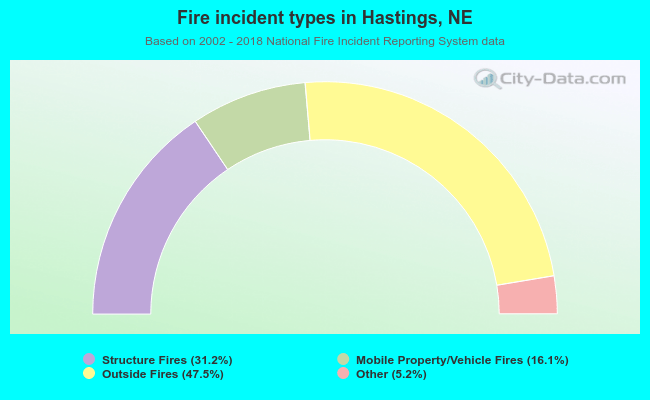 When looking into fire subcategories, the most reports belonged to: Outside Fires (47.5%), and Structure Fires (31.2%).