Grand Island: Fire Incidents, Nebraska (NE)
Where are fire incidents reported in Grand Island, NE
Something went wrong! Please refresh the page.
| Fire incidents reported | |
|---|---|
| Sreet name | Count |
| LOCUST ST | 136 |
| 13TH ST | 108 |
| 4TH ST | 106 |
| CAPITAL AVE | 106 |
| 2ND ST | 94 |
| STATE ST | 78 |
| STOLLEY PARK RD | 72 |
| WEBB RD | 68 |
| 10TH ST | 66 |
| 3RD ST | 60 |
| DIERS AVE | 60 |
| BROADWELL AVE | 58 |
| 6TH ST | 56 |
| OAK ST | 54 |
| STUHR RD | 54 |
| 7TH ST | 52 |
| 1ST ST | 50 |
| 5TH ST | 46 |
| KOENIG ST | 46 |
| 9TH ST | 42 |
| PINE ST | 42 |
| BELLWOOD DR | 40 |
| LINCOLN AVE | 40 |
| NORTH RD | 40 |
| CUSTER AVE | 38 |
| SYCAMORE ST | 38 |
| 8TH ST | 36 |
| BOGGS AVE | 34 |
| DIVISION ST | 34 |
| SHADY BEND RD | 34 |
| Other | 817 |
2002 - 2018 National Fire Incident Reporting System (NFIRS) incidents
- Incident types reported to NFIRS in Grand Island, NE
- 15,53968.1%Rescue & EMS
- 2,60511.4%Fire
- 1,6097.0%Hazardous Condition
- 1,1335.0%Service Call
- 1,0304.5%False Alarm
- 8603.8%Good Intent Call
- 290.1%Special Incident
- Fire incident types reported to NFIRS in Grand Island, NE
- 1,06040.7%Outside Fires
- 98337.7%Structure Fires
- 45617.5%Mobile Property/Vehicle Fires
- 1064.1%Other
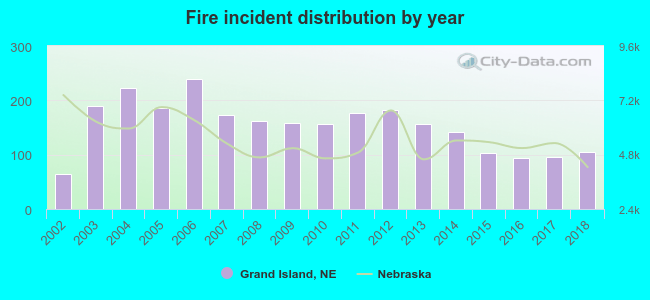 According to the data from the years 2002 - 2018 the average number of fires per year is 153. The highest number of reported fires - 240 took place in 2006, and the least - 65 in 2002. The data has a rising trend.
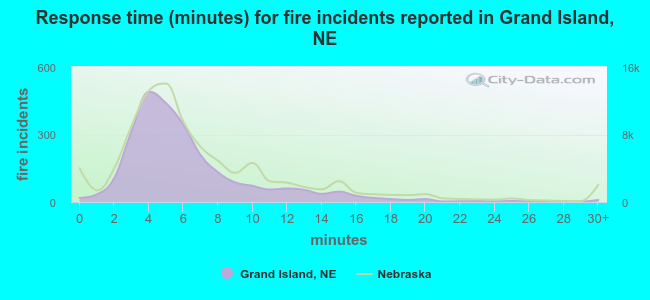 The median response time based on all reported fire incidents is 5 minutes. This is lower compared to the Nebraska median value.
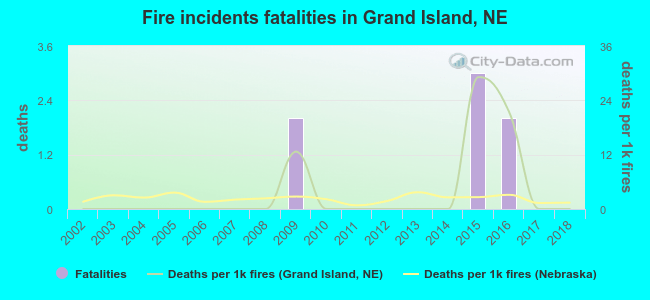 Based on the reports from the years 2002 - 2018 the average number of fire-related yearly deaths is 0. The highest number of reported deaths - 3 took place in 2015, and the lowest - 0 in 2002. The data has a constant trend.
The average number of fatalities per 1,000 fire incidents is 4. This indicator was the highest - 29 in 2015, and the lowest 0 in 2002. The trend for deaths per 1,000 fire incidents is constant. Compared to the state value the number of fatalities per 1,000 incidents is about the same.
Based on the reports from the years 2002 - 2018 the average number of fire-related yearly deaths is 0. The highest number of reported deaths - 3 took place in 2015, and the lowest - 0 in 2002. The data has a constant trend.
The average number of fatalities per 1,000 fire incidents is 4. This indicator was the highest - 29 in 2015, and the lowest 0 in 2002. The trend for deaths per 1,000 fire incidents is constant. Compared to the state value the number of fatalities per 1,000 incidents is about the same.Deaths per 1,000 incidents in Grand Island, NE compared to nearest cities:
(Note: Based on data for all years, including only cities with at least 2,500 fire incidents)
| Grand Island: | 2.7 |
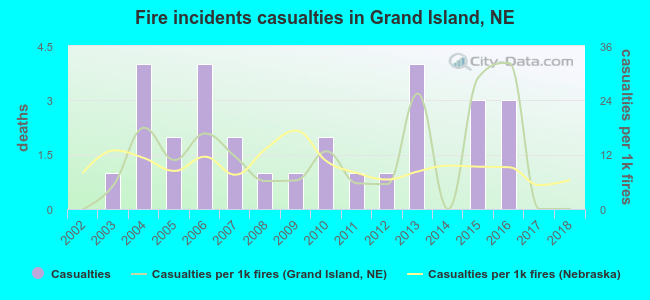 According to the reports from the years 2002 - 2018 the average number of fire-related yearly casualties is 2. The highest number of reported injuries - 4 took place in 2004, and the lowest - 0 in 2002. The data has a constant trend.
The average number of casualties per 1,000 fire incidents is 11. This indicator was the highest - 32 in 2016, and the lowest 0 in 2002. The trend for casualties per 1,000 fires is constant. Compared to the Nebraska value the number of casualties per 1,000 incidents is about the same.
According to the reports from the years 2002 - 2018 the average number of fire-related yearly casualties is 2. The highest number of reported injuries - 4 took place in 2004, and the lowest - 0 in 2002. The data has a constant trend.
The average number of casualties per 1,000 fire incidents is 11. This indicator was the highest - 32 in 2016, and the lowest 0 in 2002. The trend for casualties per 1,000 fires is constant. Compared to the Nebraska value the number of casualties per 1,000 incidents is about the same.
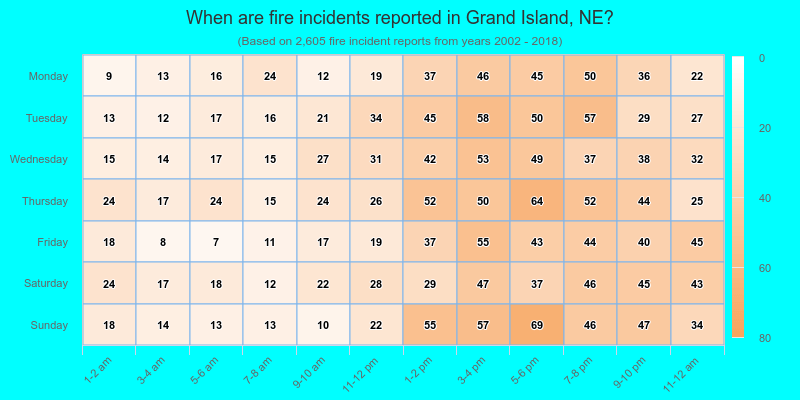
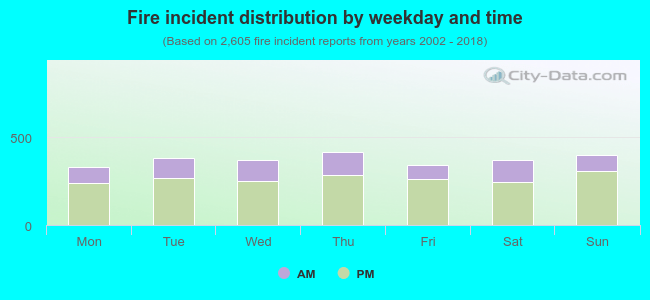 28.6% incidents where reported in the morning and 71.4% in the evening. The most fires (16.0%) took place on Thursday, and the least (12.6%) on Monday.
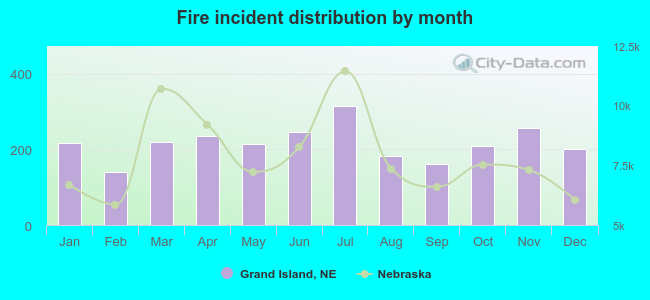 According to the 2,605 fire incidents from years 2002 - 2018 most fires (12.1%) took place during July, and the least (5.4%) in February.
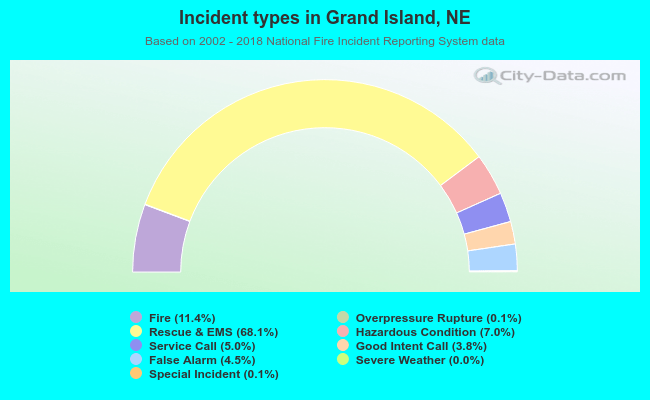 Out of all 22,826 cases reported during the years 2002 - 2018, the most belonged to the categories: Rescue & EMS (68.1%), Fire (11.4%), and Hazardous Condition (7.0%).
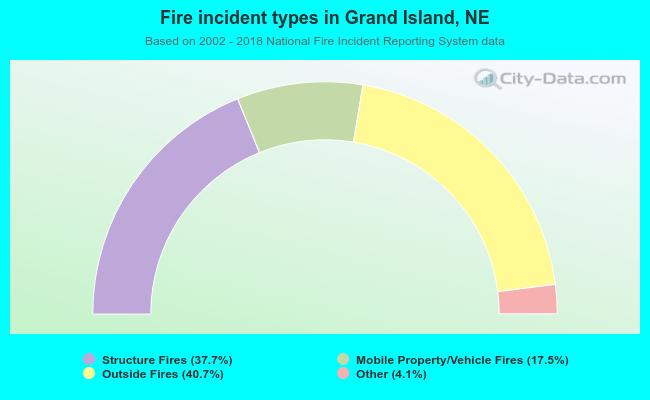 When looking into fire subcategories, the most incidents belonged to: Outside Fires (40.7%), and Structure Fires (37.7%).