Harvard: Fire Incidents, Massachusetts (MA)
Where are fire incidents reported in Harvard, MA
Something went wrong! Please refresh the page.
|
| |||||||||||||||||||||||||||||||||||||||||||||||||||||||||||||||||||||||||||||||||||||||||||||||||||||||||||||
2002 - 2018 National Fire Incident Reporting System (NFIRS) incidents
- Incident types reported to NFIRS in Harvard, MA
- 50026.2%Fire
- 45323.8%False Alarm
- 32917.3%Rescue & EMS
- 26814.1%Hazardous Condition
- 1769.2%Service Call
- 1688.8%Good Intent Call
- 60.3%Severe Weather
- 50.3%Overpressure Rupture
- Fire incident types reported to NFIRS in Harvard, MA
- 22144.2%Outside Fires
- 20841.6%Structure Fires
- 5611.2%Mobile Property/Vehicle Fires
- 153.0%Other
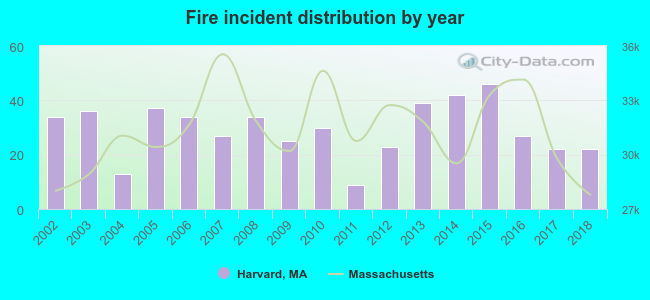 According to the data from the years 2002 - 2018 the average number of fires per year is 29. The highest number of fires - 46 took place in 2015, and the least - 9 in 2011. The data has a dropping trend.
The average number of yearly fire incidents per 10k residents in Harvard, MA compared to nearest cities:
(Note: Based on data for the last 3 years, including only cities with population 5,000 and above)
| Harvard: | 36.3 |
| Lancaster: | 34.3 |
| Littleton: | 35.5 |
| Stow: | 22.8 |
| Leominster: | 62.0 |
| Clinton: | 88.9 |
| Acton: | 24.9 |
| Hudson: | 44.1 |
| Maynard: | 25.7 |
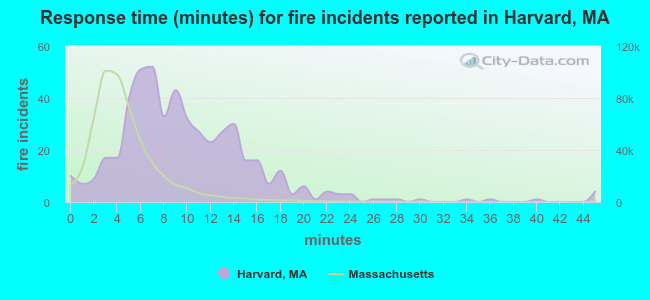 The median response time based on all reported fire incidents is 9 minutes. This is much higher than the state median value.
The median response time in Harvard, MA compared to nearest cities:
(Note: Based on data for all years, including only cities with at least 500 fire incidents)
| Harvard: | 9 minutes |
| Ayer: | 4 minutes |
| Littleton: | 6 minutes |
| Leominster: | 4 minutes |
| Clinton: | 3 minutes |
| Acton: | 4 minutes |
| Lunenburg: | 6 minutes |
| Hudson: | 3 minutes |
| Westford: | 6 minutes |
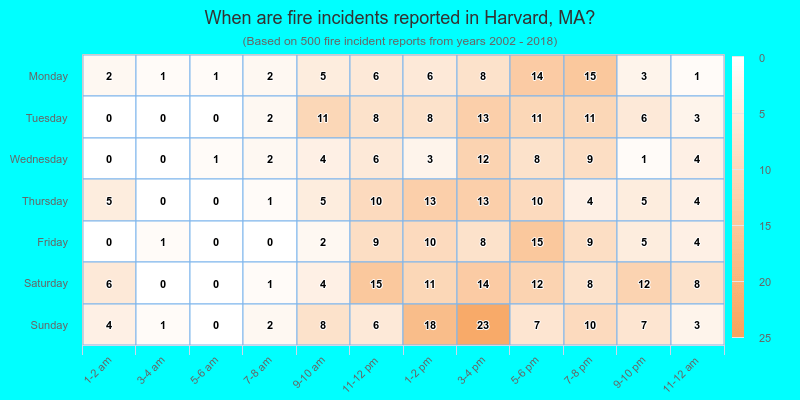
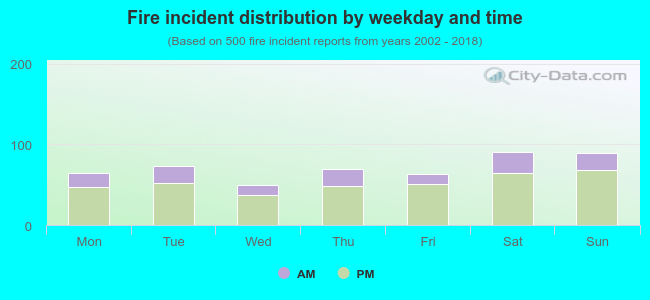 26.2% incidents where reported in the morning and 73.8% in the evening. The most fires (18.2%) took place on Saturday, and the least (10.0%) on Wednesday.
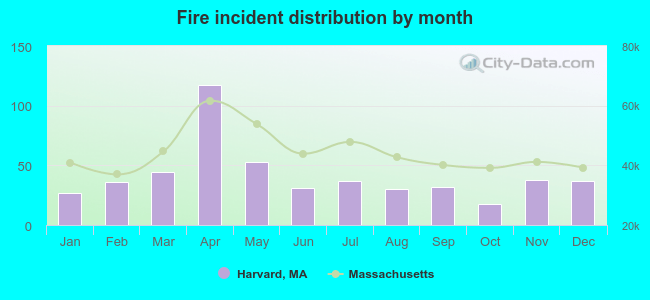 According to the 500 reports from years 2002 - 2018 most fires (23.4%) took place during April, and the least (3.6%) in October.
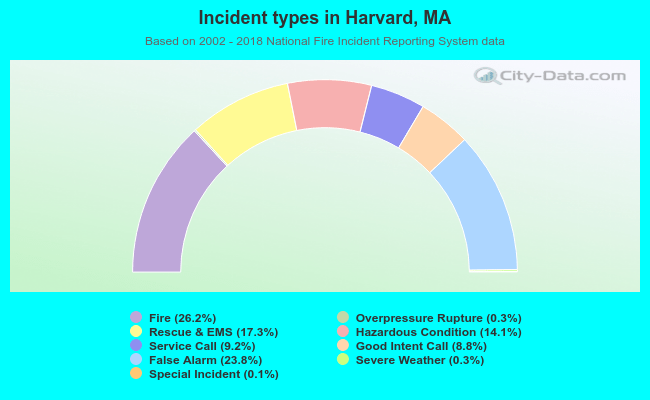 Out of all 1,906 cases reported during the years 2002 - 2018, the most belonged to the categories: Fire (26.2%), False Alarm (23.8%), and Rescue & EMS (17.3%).
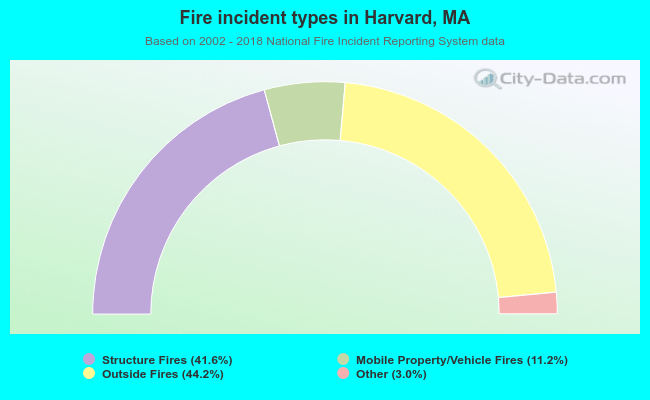 When looking into fire subcategories, the most incidents belonged to: Outside Fires (44.2%), and Structure Fires (41.6%).