| Fire incidents reported |
|---|
| Sreet name | Count |
|---|
| CHAPEL ST | 74 | | HARRISVILLE MAIN ST | 34 | | EAST AVE | 26 | | SHERMAN FARM RD | 26 | | STEERE FARM RD | 22 | | CENTRAL ST | 20 | | BROOK RD | 16 | | CALLAHAN SCHOOL ST | 16 | | CHERRY FARM RD | 14 | | TINKHAM LN | 14 | | RAILROAD AVE | 12 | | STEERE ST | 12 | | MOWRY ST | 10 | | EMERSON RD | 8 | | HILL RD | 8 | | ROUND TOP RD | 8 | | DOUGLAS PIKE | 6 | | MOUNT PLEASANT RD | 6 | | W IRONSTONE RD | 6 | | BLACK HUT RD | 4 | | COLLINS TAFT RD | 4 | | HEMLOCK FARM TRL | 4 | | JOSLIN RD | 4 | | KENNEDY LANE | 4 | | SMITH HILL RD | 4 |
| | | Fire incidents reported |
|---|
| Sreet name | Count |
|---|
| SMITH RD | 4 | | BARNES RD | 2 | | BENEDICT RD | 2 | | BRONCO HWY | 2 | | BUXTON ST | 2 | | CALLAHAN SCHOOL STREET | 2 | | COLWELL RD | 2 | | CONLEY LA | 2 | | COVE RD | 2 | | FERN DR | 2 | | FOSTER ST | 2 | | LIBERTY CIR | 2 | | MILL POND DR | 2 | | OLD MILL ST | 2 | | OLD NASONVILLE | 2 | | PASCOAG MAIN ST | 2 | | RIVER ST | 2 | | SANWOOD DR | 2 | | SPRING LAKE RD | 2 | | STEWART CT | 2 | | W HARTFORD AVE | 2 | | WATERFRONT LANE | 2 | | WEST RD | 2 | | WHIPPLE AVE | 2 | | |
|
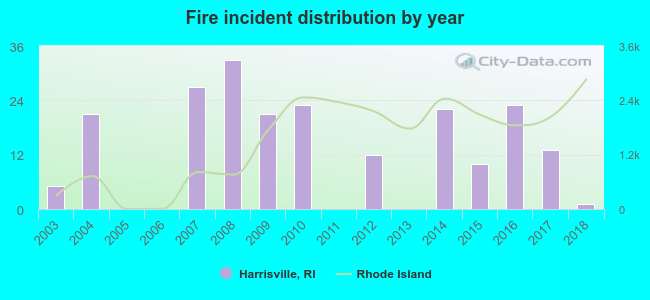 According to the data from the years 2003 - 2018 the average number of fire incidents per year is 13. The highest number of fires - 33 took place in 2008, and the least - 0 in 2005. The data has a dropping trend.
 35.5% incidents where reported in the morning and 64.5% in the evening. The most fires (18.5%) took place on Thursday, and the least (11.4%) on Friday.
 According to the 211 fire incidents from years 2003 - 2018 most fires (15.2%) took place during April, and the least (2.8%) in September.
 Out of all 2,241 cases reported during the years 2003 - 2018, the most belonged to the categories: Rescue & EMS (64.8%), Fire (9.4%), and Service Call (7.6%).
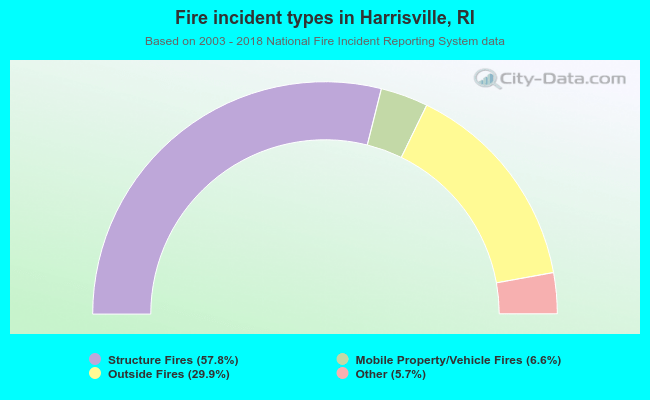 When looking into fire subcategories, the most incidents belonged to: Structure Fires (57.8%), and Outside Fires (29.9%).